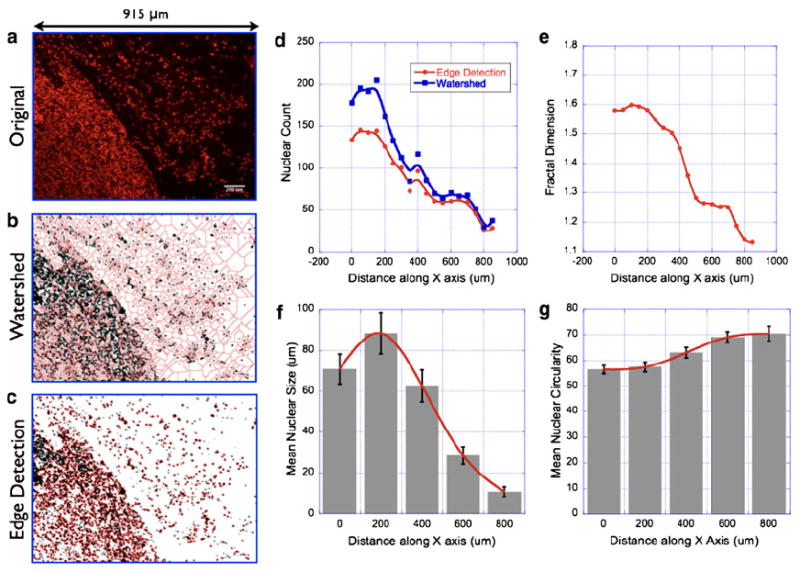
Fig. 2.

Nuclear morphometry/topology analysis in thin sections of breast tumor tissues. Representative nuclear fluorescence image of a tumor tissue section with a bordering normal epithelium (a) (Scale bar = 200 μm). The nuclear area fraction is significantly higher in the tumor region as compared with that of the normal epithelium. In order to quantify these differences, morphometric parameters were analyzed in multiple tissue sections and presented here. See main text for discussion on statistical analysis. Image segmentation by watershed algorithm (b) and edge-detection algorithm (c) yielded two different models for quantifying the nuclear distribution in the images. The original image (915 μm × 684 μm) was divided into regular subunits of size (20 μm × 684 μm). Mean nuclear count in each image subunit by the two aforementioned algorithms as shown in (d). Although both the algorithms yielded similar spatial profile of nuclear distribution in the tissue images, the edge-detection approach was found to be more accurate in delineating the individual nuclei in a cluster whose size was beyond the resolution of the optical imaging system. Fractal dimension was also computed in these image subunits as described in the main text and presented in (e). Mean nuclear size and circularity are shown in (f) and (g)
