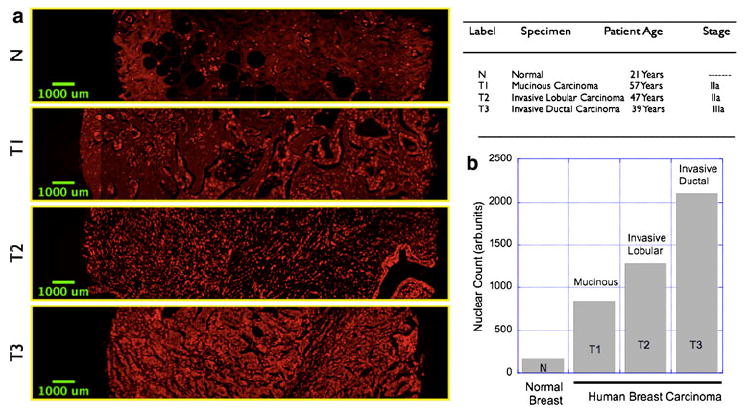
Fig. 5.

Nuclear morphometry imaging in human tissue microarray. a Representative images showing the nuclear distribution in normal, human breast (fibrofatty) tissue as well as in three breast carcinoma specimens with varying degrees of aggressiveness. The details of the specimens are given in the accompanying table. b Nuclear count and hence the nuclear area fraction increases progressively in accordance with the aggressiveness
