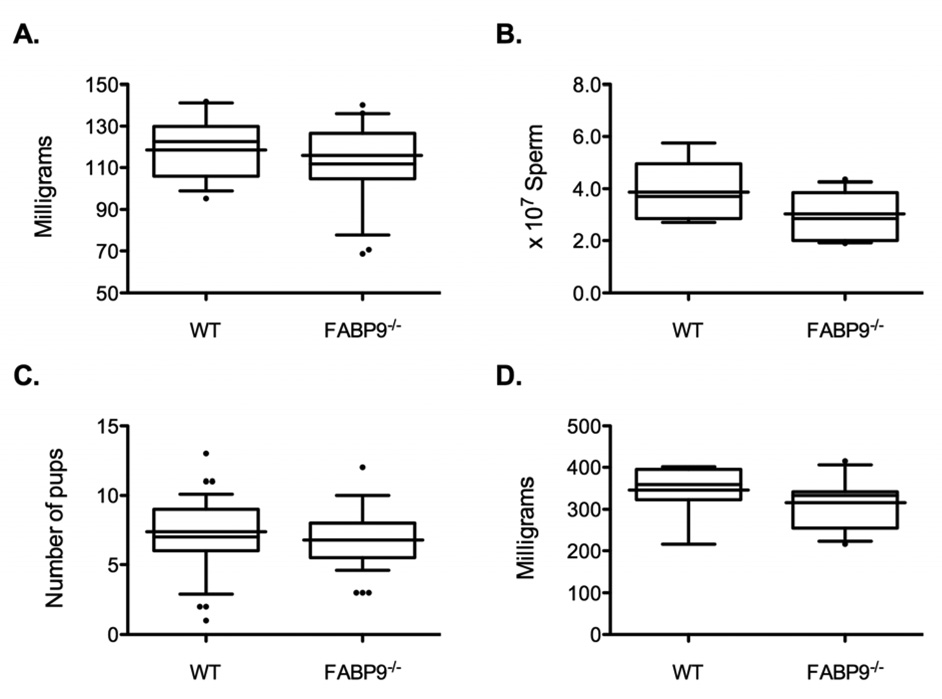
Fig. 4. Phenotypic analysis of FABP9−/− mice.
Box plots show the spread of values for the different parameters analyzed. The lower and upper ends of the box mark the 25th and 75th quantiles; the median is represented as a horizontal line within the box, and the mean as a horizontal line through the box. Vertical whiskers extend from the ends of the box to the 10th and 90th quantiles. Comparisons for: (A) testis weights, (B) cauda epididymal sperm counts, (C) litter sizes and (D) seminal vesicle weights are shown (n=9–11/group). For these comparisons, 12-week-old FABP9−/− and WT mice were used for sperm counts and other morphometric parameters; litter sizes were obtained from breeding trials.

