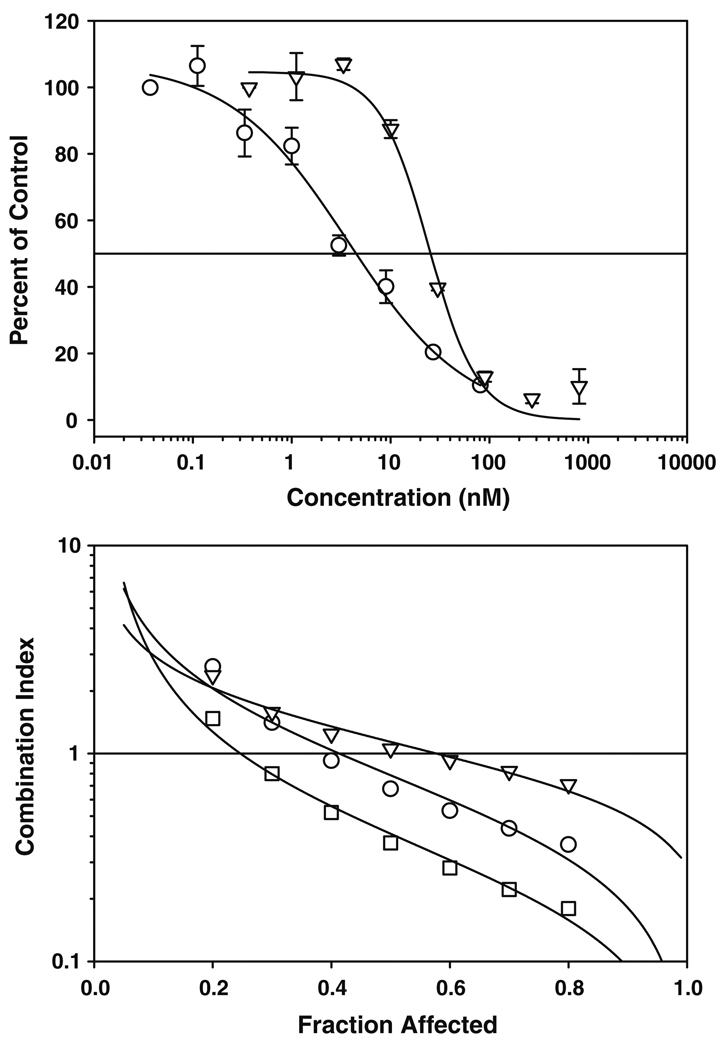
Fig. 5.
Impact of drug sequence on interaction of BACPT and gemcitabine in Panc-1 cells. Top panel dose–response curves for Panc-1 cells treated with BACPT (open circle) or gemcitabine (open inverted triangle) for 3 days followed by 2 days in drug-free medium. Surviving cells were quantified by ATP assay. Bottom panel Panc-1 cells were exposed simultaneously to BACPT and gemcitabine (open circle), to BACPT followed 24 h by gemcitabine (open inverted triangle), or gemcitabine followed by BACPT (open square) at a molar ratio of 100:1 (gemcitabine:BACPT) for 3 days followed by 2 days in drug-free medium. Surviving cells were quantified by ATP assay and the combination index computed as a function of the fraction of cells affected (fa), where fa = 0.5 is the IC50

