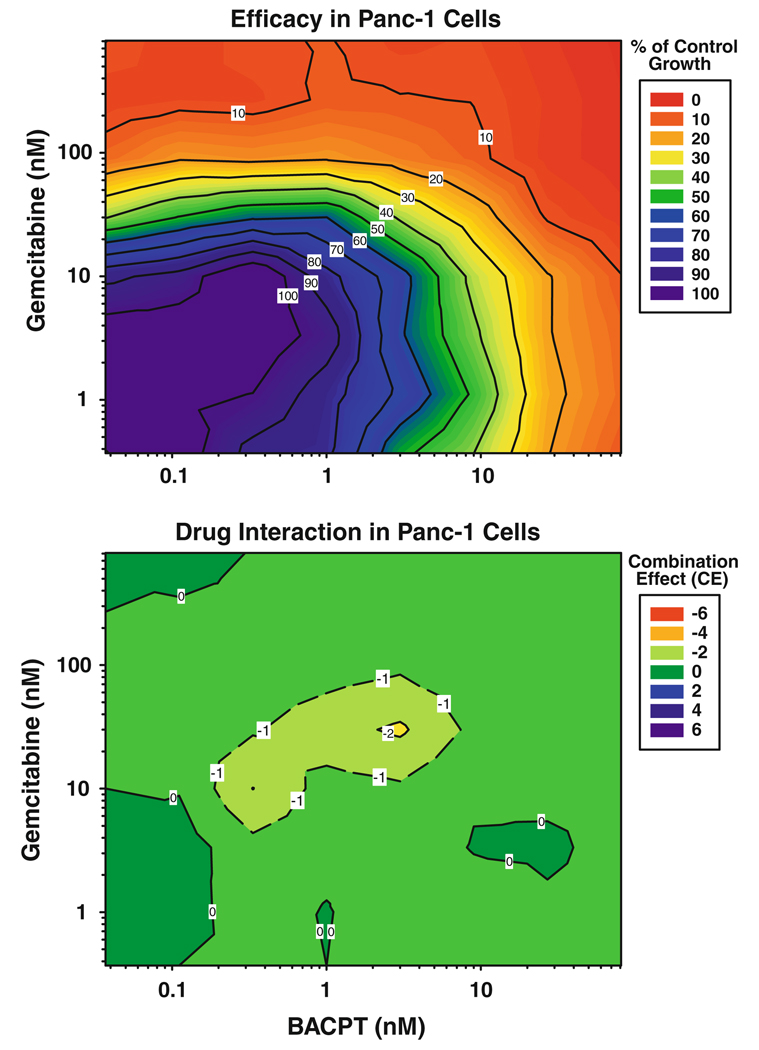
Fig. 6.
Impact of drug ratio on the interaction of gemcitabine followed by BACPT in Panc-1 cells. 3-dimensional drug interaction analysis was performed for gemcitabine followed 24 h later with BACPT in Panc-1 cells as described in “Methods”. Top panel percent inhibition of tumor cell growth compared to untreated controls, color-coded to indicate the range of response from minimum (blue) to maximum (red) inhibition. Bottom panel the corresponding combination effect (CE) surface is presented as a color-coded contour map where green represents additivity (CE = 0), red antagonism (CE < 0) and blue synergy (CE > 0)

