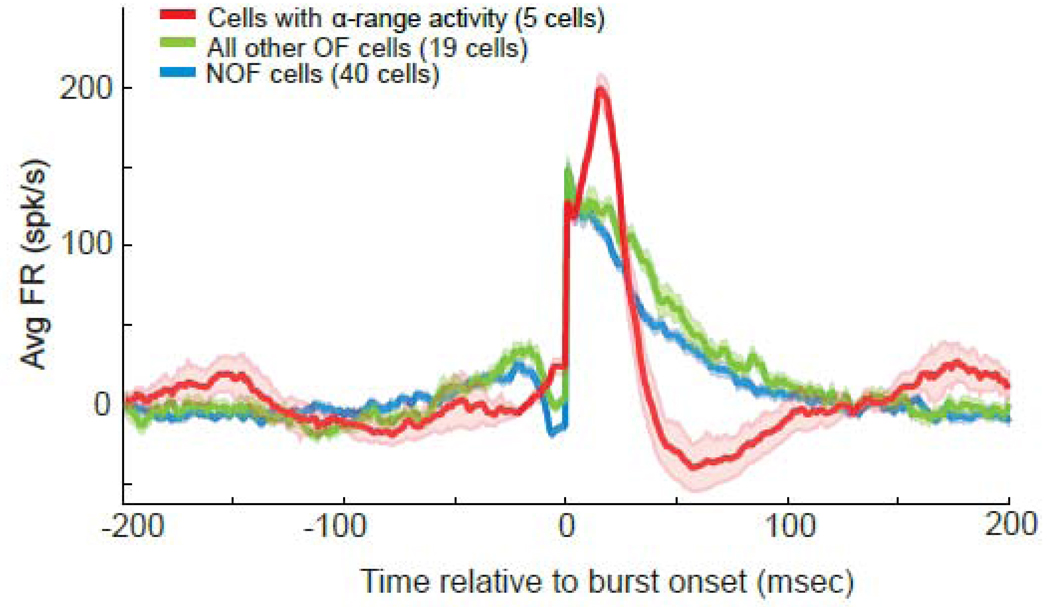
Figure 5.
Population averages of mean peri-burst frequency of firing for α-range OF cells, NOF cells, and all other OF cells with > 5 bursts. Firing rates were normalized individually by each cell’s mean firing rate in the 200-msec preceding burst onset prior to averaging across cells. Shaded areas denote 95% confidence intervals for each population mean. Note the shorter burst duration and greater maximum intra-burst firing rate that occurred later in the bursts in α-range OF cells in comparison with all other OF and NOF cells.

