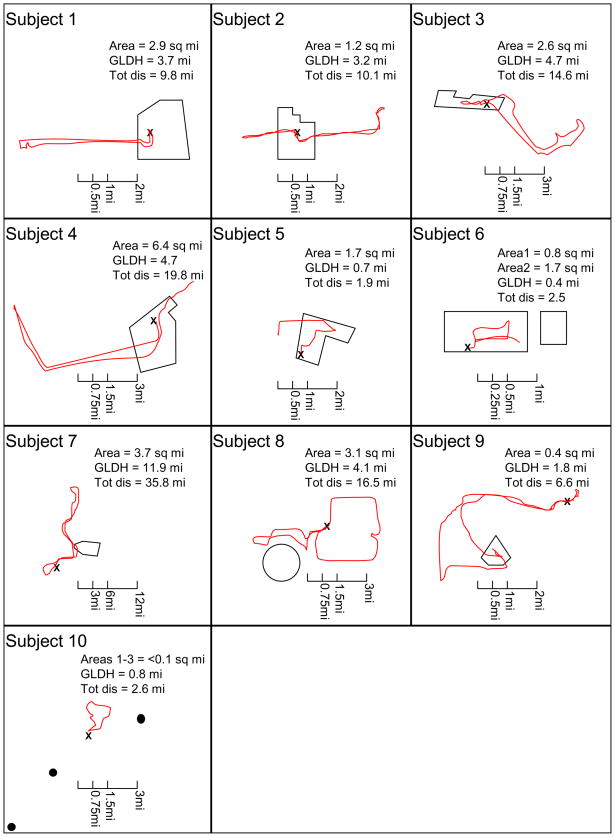
Figure 2. Paths of 10 subjects’ 24-hour daily activities, shown in conjunction with their hand-drawn neighborhood depiction and home location.
Area(s) refers to approximate land area of what each subject hand-drew on a map to represent their “neighborhood.”
GLHD = Greatest linear distance from home.
Tot dis = Route total distance
X = Location of subject’s residence.

