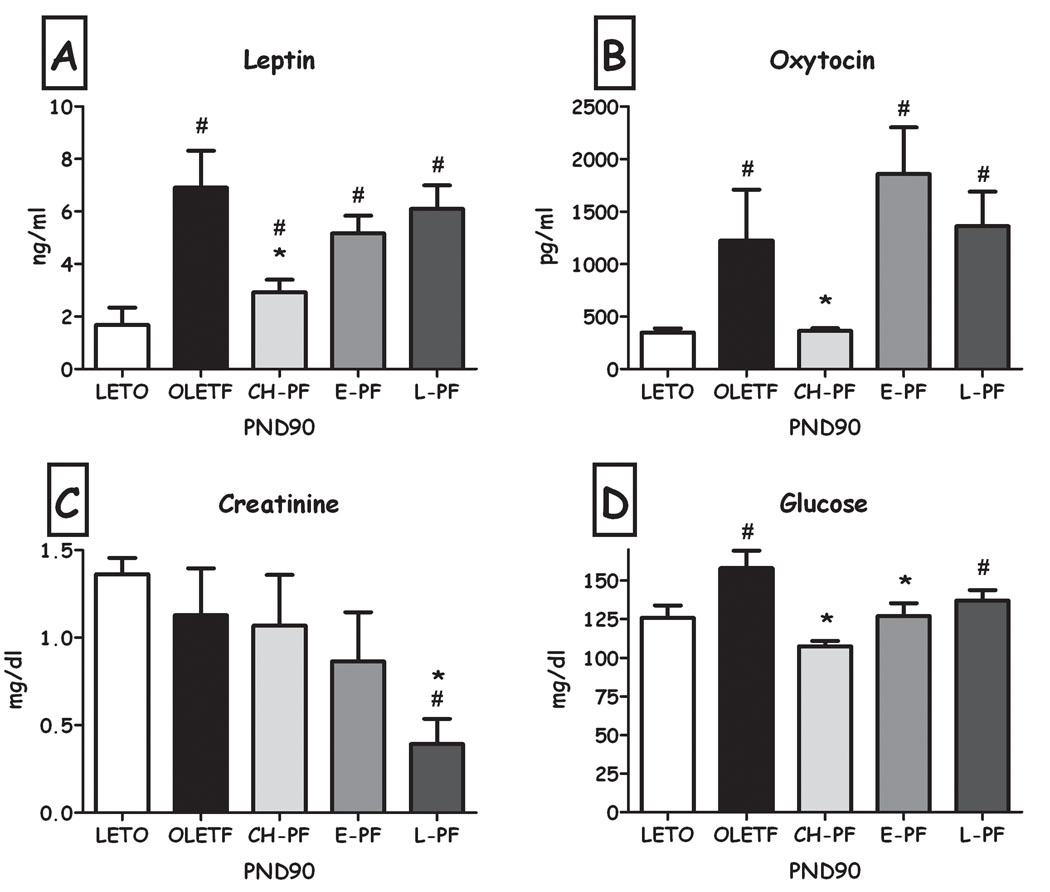
Fig. 9.
Plasma leptin (A), Oxytocin (B), Creatinine (C) and Glucose (D) levels of LETO, OLETF, chronic (CH-PF), early (E-PF) and late (L-PF) pair-feeding OLETF females on PND90. Data are presented as means and SEM. *p<0.05 for significant differences compared to OLETF controls; # p<0.05 for significant differences compared to LETO controls. N= 4–6 per group.

