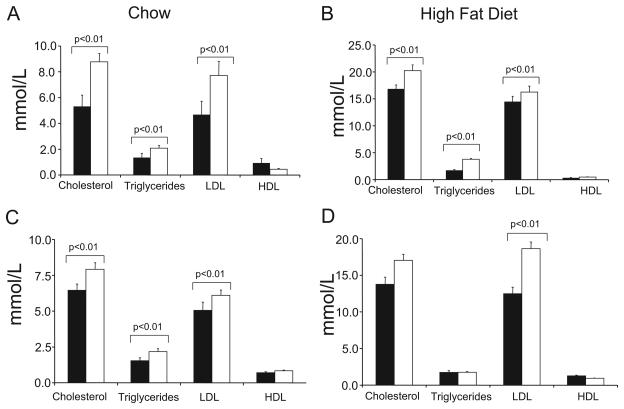
Figure 2. ATM+/−/ApoE−/− mice show hyperlipidemia.
A and B, Serum lipids in ATM+/+/ApoE−/− (black bars) (n=13) or ATM+/−/ApoE−/− (open bars) (n=15) mice fed either normal chow (A) or after 14 weeks of fat feeding (B). C and D, Serum lipids in ATM+/+/ApoE−/− or ATM+/−/ApoE−/− mice receiving ATM+/+/ApoE−/− BMT, fed either normal chow (n=7) (C) or after 14 weeks of fat feeding (n=8) (D).

