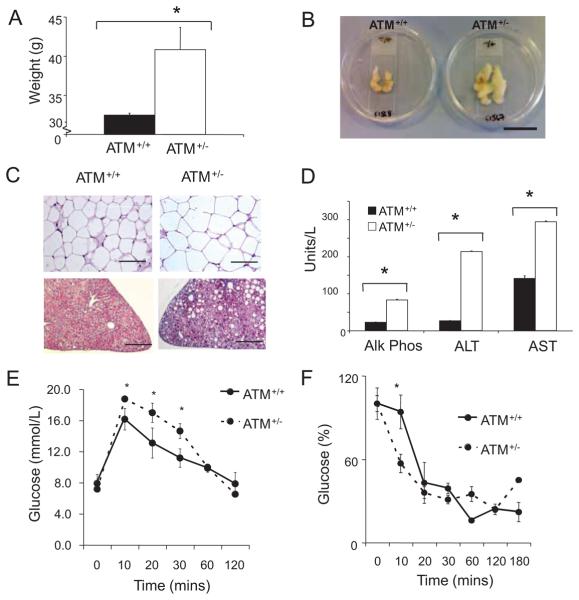
Figure 3. ATM+/−/ApoE−/− mice show multiple features of the metabolic syndrome.
A, Body weight for ATM+/+/ApoE−/− (n=10) and ATM+/−/ApoE−/− (n=6) mice after 14 weeks of high-fat feeding. B, Abdominal visceral fat pad from same experimental groups as in A. Scale bar is ≈4 cm. C, Representative (×20) images of white adipose tissue demonstrating adipocyte hypertrophy (upper images) and H and E-stained liver sections showing hepatic steatosis (lower images). Scale bar is 200 μm. D, Serum liver enzymes including alkaline phosphatase (AlkPhos), alanine transaminase (ALT), and aspartate transaminase (AST) in ATM+/+/ApoE−/− mice and ATM+/−/ApoE−/− mice. *P<0.001 (n=5). E, Fasted glucose tolerance test in ATM+/+/ApoE−/− mice and ATM+/−/ApoE−/− mice after 7 weeks of high-fat feeding (n=5). F, Insulin tolerance test in ATM+/+/ApoE−/− mice and ATM+/−/ApoE−/− mice after 7 weeks of high-fat feeding. All data are means; error bars represent SEMs. *P=<0.01 (n=5).

