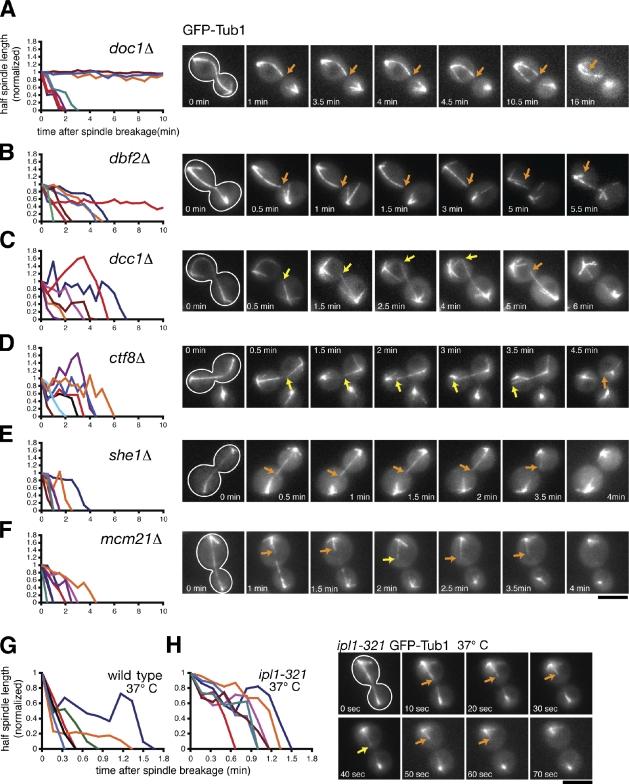
Figure 4.
Dynamics of ipMT depolymerization in spindle disassembly mutants. (A–F) Cells expressing the spindle marker GFP-Tub1 were analyzed by time-lapse microscopy during mitotic exit similar to the experiments described in Fig. 1 (A–C). Cells were incubated at 23°C. The cell periphery is outlined in white. Orange arrows track shrinking spindle halves, whereas yellow arrows track growing spindle halves. (left) Line graphs represent the normalized lengths of individual depolymerizing spindle halves after the spindle had broken. (G and H) Comparison of spindle disassembly in wild-type and ipl1-321 cells incubated at 37°C. Bars, 5 µm.

