Figure 4.
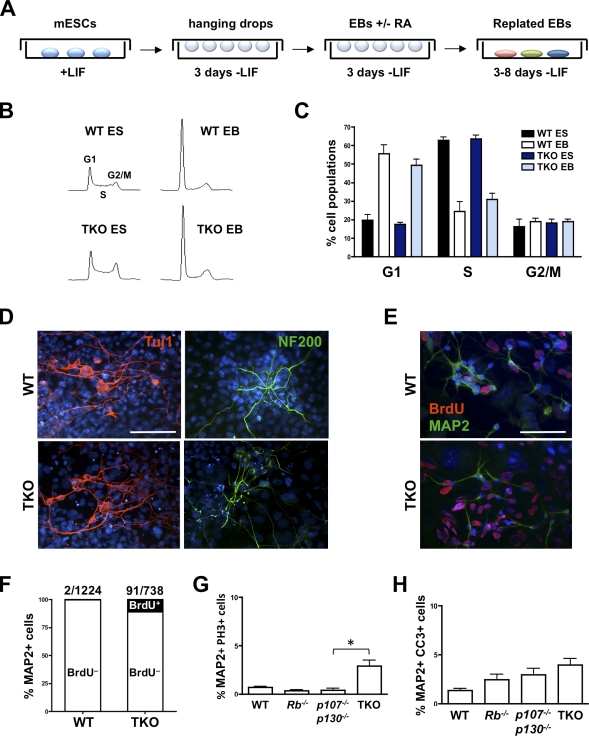
TKO embryonic stem cells generate differentiated cells in culture. (A) Generation of EBs from mESCs in culture. mESCs were cultured without LIF in hanging drops for 3 d. Retinoic acid (RA) was added to induce neuronal differentiation. After three additional days of growth in hanging drops, EBs were plated and allowed to differentiate for 1 wk. (B) Cell cycle analysis by propidium iodide staining in WT and TKO mESCs (ES) and EBs. (C) Quantification of the cell cycle analysis (n ≥ 3 for each genotype). (D) Immunostaining for the neuronal markers Tuj1 (red) and NF200 (green) in WT and TKO EBs. Nuclei were visualized with DAPI (blue). Bar, 100 µm. (E) Immunostaining for the neuronal marker MAP2 (green) and BrdU (red) in WT and TKO EBs. Bar, 100 µm. (F) Quantification of MAP2+/BrdU+ cells. A significantly higher number of TKO neurons are BrdU+ compared with WT neurons (P = 0.0073), but the vast majority of TKO neurons are BrdU–. (G) Numbers of MAP2+ cells that are in M phase (stained with PH3) in TKO and control cultures 1 wk after re-plating of EBs (n ≥ 3 for each genotype; *, P = 0.0248). (H) Numbers of CC3+ apoptotic MAP2+ cells in TKO and control EBs 1 wk after re-plating (n = 4 for each genotype). Error bars indicate standard deviation.

