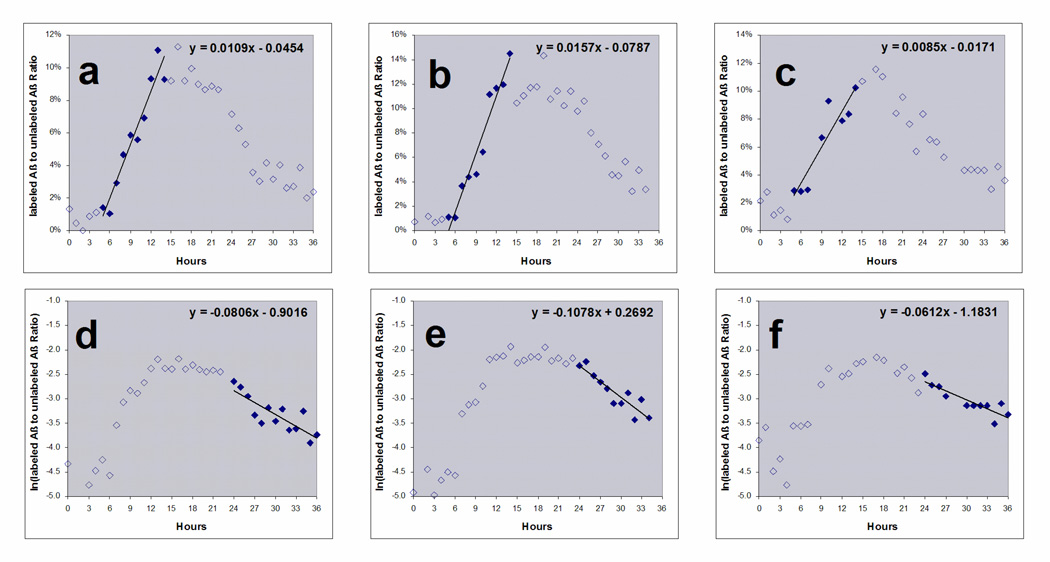
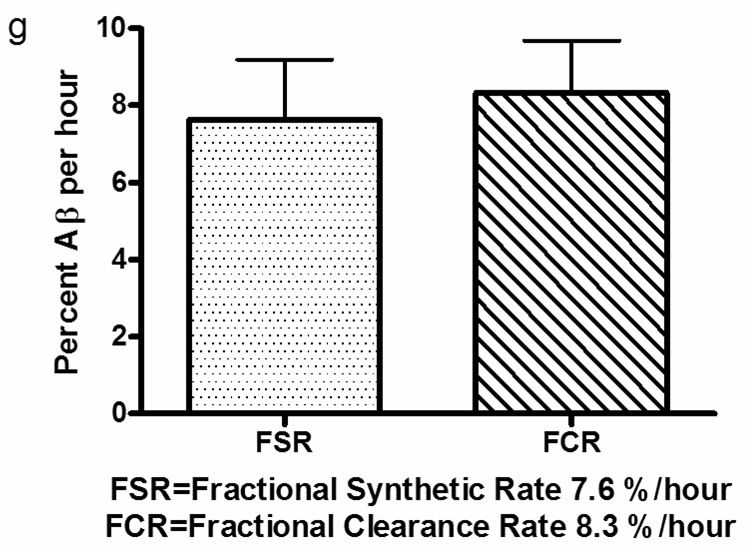
Figure 4.
FSR and FCR of labeled Aβ curves from 3 participants with 9 hour label infusion and 36 hour sampling. FSR (a–c) is calculated by the slope of increasing labeled Aβ divided by the predicted steady state value. The predicted steady state value was estimated as the average CSF labeled leucine measured during labeling. The slope was defined to start after 4 to 6 hours lag time when there was no increase in labeled Aβ and ending 9 hours later (solid diamonds). The slope of FCR (d–f) is calculated by the slope of the natural logarithm of percent labeled Aβ from hours 24 to 36. (g) Average Aβ FSR & FCR: The average Aβ FSR of 6 participants and the average Aβ FCR of 3 participants is shown with standard deviation.


