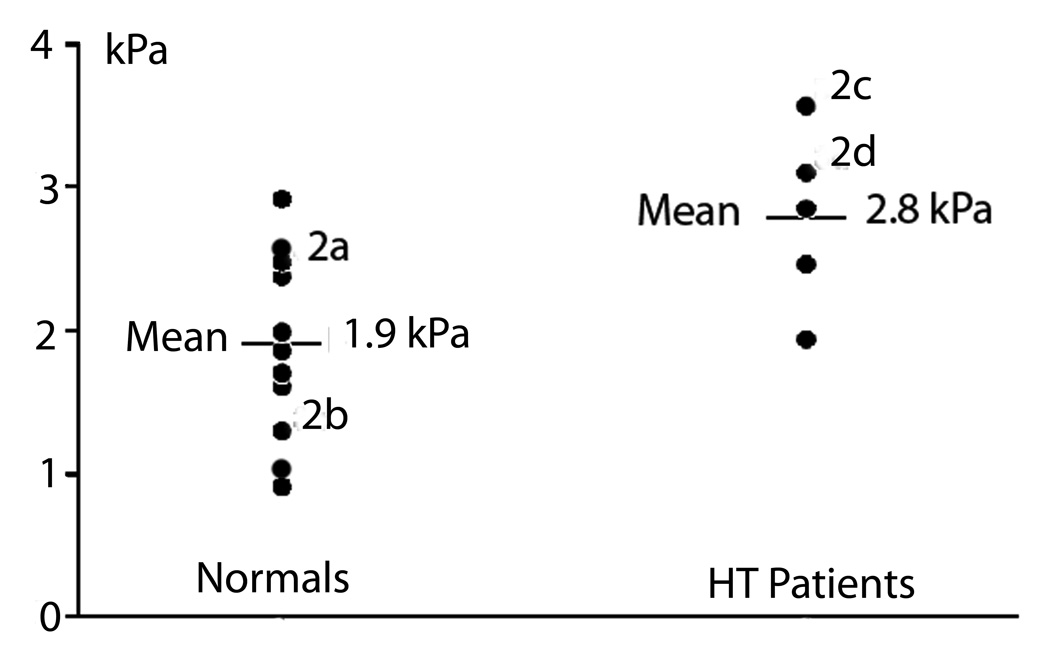
Figure 3.
The shear modulus values using 100 Hz shear waves for all Normal and HT volunteers in the study. The difference between the mean stiffness of the Normal and the HT group was significant at 100 Hz (p=0.004). The superscripts 2a-2d correspond to the thyroid gland images in Figure 2.

