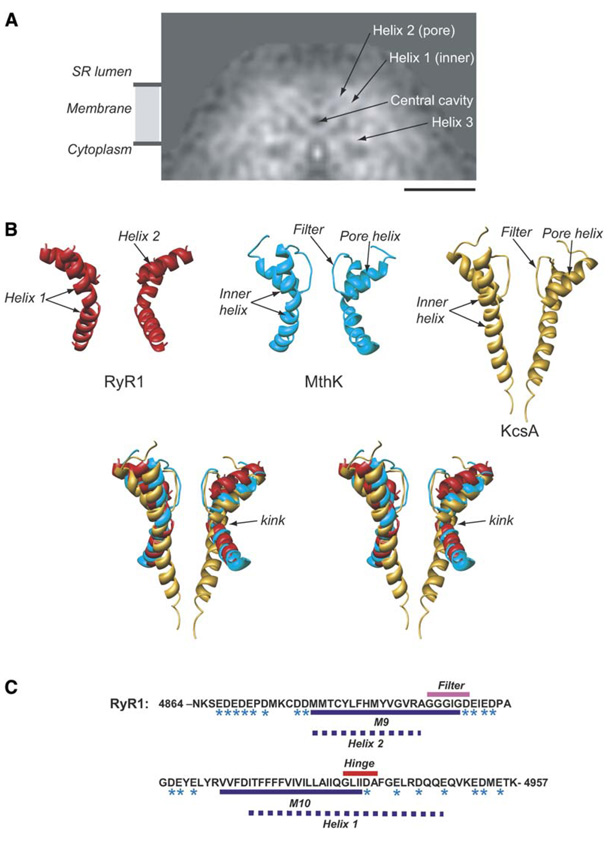
Figure 4. Interpretation of α Helices around the Putative Pore.
(A) A slice of density through RyR1 parallel to the 4-fold axis in the direction indicated by the arrows in (Figure 2A).
(B) Relative arrangement of pore and inner helices from two opposing subunits of the cryoEM map of RyR1 (red). X-ray structures of the MthK channel, 1LNQ (cyan), and of the KcsA channel, 1BL8 (gold), are shown. Two subunits of the RyR1, MthK, and KcsA pore-forming regions are superimposed and are oriented with the cytoplasmic side facing down.
(C) Sequence of the putative pore-forming region of RyR1 (GI: 134134). Residues with negative charges are marked with an asterisk. The dashed lines denote our prediction for the pore-forming helices of RyR1: residues M4879–A4893 correspond to the inner, pore-lining helix (helix 1); residues I4918– E4948 correspond to the P helix (helix 2). The bar in (A) denotes 50 Å scale.

