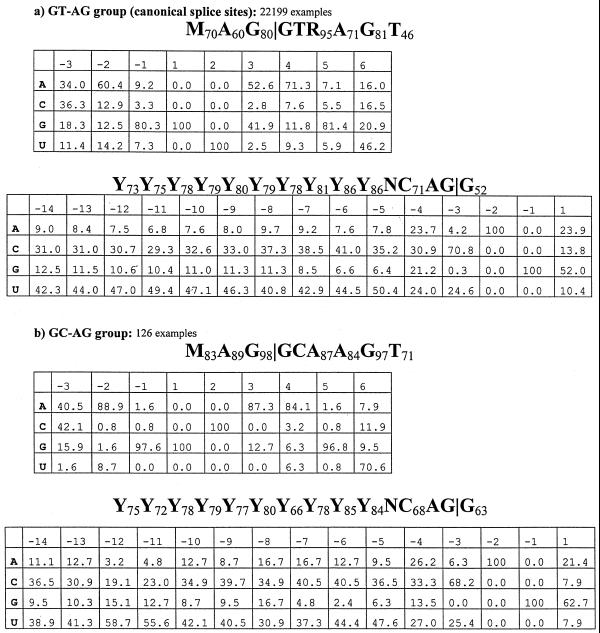
Figure 2.
Consensus sequences and weight matrices for major groups of splice site pairs. Frequency matrices have only been calculated for major splice site groups (GT–AG and GC–AG). In the first row we indicated positions with respect to the splice cut point, which is always between –1 and 1. It should be taken into account that negative numbers in donor matrices correspond to exonic regions, but in acceptor matrices positive numbers correspond to exonic regions. In consensus sequences | means cut position (M: A or C, R: A or G, Y: C or T, S: C or G).


