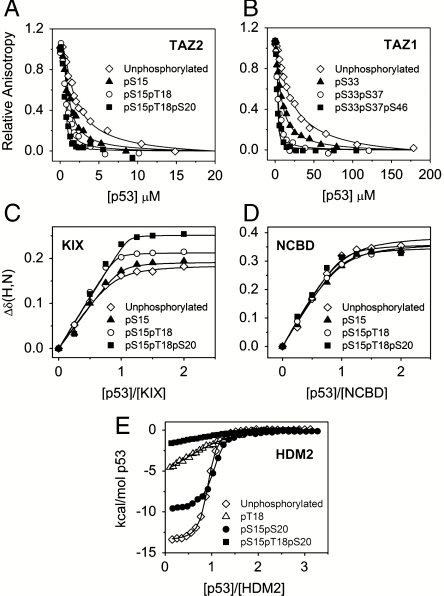
Fig. 2.
Binding of unphosphorylated and phosphorylated p53 TAD to CBP domains and HDM2. (A) Representative fluorescence anisotropy titration curves for the competition of unlabeled p53 peptides (unphosphorylated p53 TAD, pS15, pS15pT18, pS15pT18pS20) with fluorescently labeled p53 TAD bound to TAZ2. (B) Representative fluorescence anisotropy titration curves for the competition of unlabeled p53 peptides (unphosphorylated p53, pS33, pS33pS37, pS33pS37pS46) with fluorescently labeled p53 TAD bound to TAZ1. (C) HSQC titration curves for Arg671 of KIX showing the weighted average of the 15N and 1H chemical shift changes, Δδ(N,H)av, as a function of concentration ratio for the titration of 15N-labeled KIX with unphosphorylated and phosphorylated p53 peptides (pS15, pS15pT18, pS15pT18pS20). (D) Titration curves for Met2098 in the NCBD showing the average of the 15N and 1H chemical shift changes [Δδ(N,H)av] as a function of concentration ratio for the titration of 15N-labeled NCBD with unphosphorylated and phosphorylated p53 peptides (pS15, pS15pT18, pS15pT18pS20). Δδ(N,H)av = [(ΔδHN)2 + (ΔδN/5)2]1/2. Values of Δδ(N,H)av are plotted as symbols, and the continuous lines show the curves fitted globally to a one-site binding model. (E) ITC data for binding of HDM2 to unphosphorylated and phosphorylated p53 peptides (pT18, pS15pS20, pS15pT18pS20).

