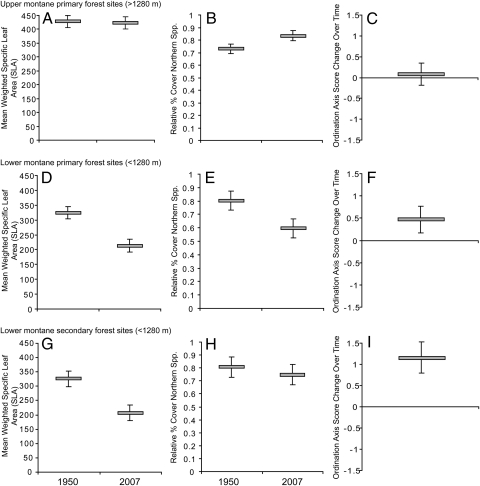
Fig. 1.
Plant-community changes related to climatic warming. Means and 95% confidence limits are shown for the weighted abundance of SLA per plot, relative percent of cover by species with northern biogeographic affinities, and the change in ordination axis score values for changes caused by climatic position in the environment. Means are shown for each response variable for upper montane primary forest sites (A–C), lower montane primary forest sites (D–F), and lower montane secondary-growth forest sites (G–I). These three multiple response variables changed significantly over time as a function of community type (MANOVA, Pillai's trace; F = 18.16; df = 6, 256; P < 0.001).

