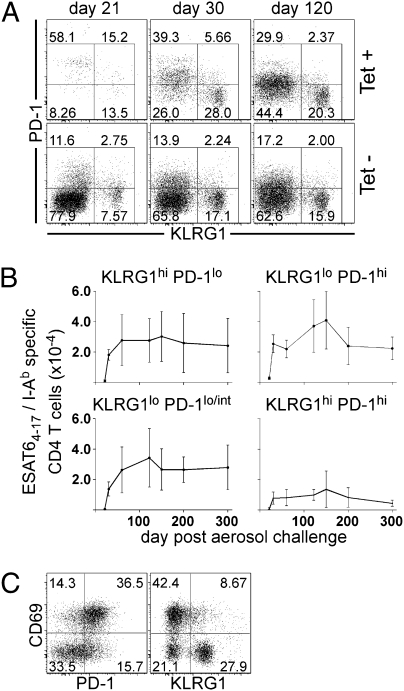
Fig. 2.
Antigen-specific cells display markers of terminal differentiation or senescence during Mtb infection. (A) Flow cytometric gating strategy used to analyze KLRG1 and PD-1 expression on ESAT64–17/I-Ab antigen-specific CD4 T cells. (B) The number of KLRG1- and PD-1–expressing ESAT64–17/I-Ab antigen-specific CD4 T cells during Mtb infection. Data are presented from the lungs of five mice analyzed on each day. The error bars indicate the SD. The data are representative of two independent experiments. (C) The dot plots are representative of the CD69 and PD-1 or CD69 and KLRG1 expression on ESAT64–17/I-Ab antigen-specific CD4 T cells isolated from lungs of mice on day 30 postinfection.

