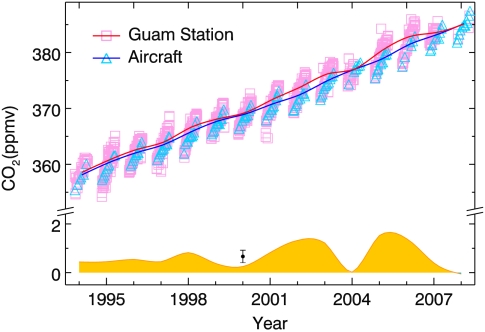
Fig. 6.
Comparison of CO2 winter averages from 1994 to 2008 between NOAA ESRL ground station (pink line) and CONTRAIL airborne flask measurements (blue line) over Guam (13.45 °N, 144.8 °E). Each square or triangle represents an individual measurement being used. During each flight, an individual airborne measurement shown in the figure is defined as an average of all flask measurements conducted between 5 °N–20 °N and 10–12 km. The yellow-filled area shows the ground-station values subtracted by the aircraft ones. The 15-y averaged difference is 0.67 ± 0.26 ppmv (black dot with an error bar).

