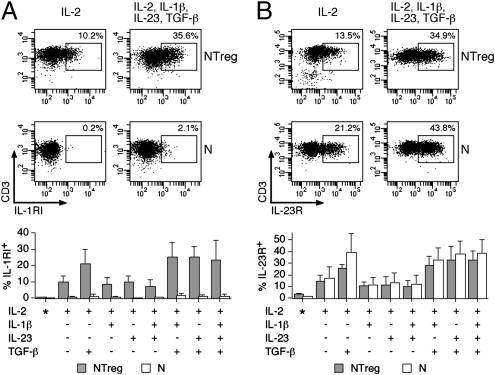
Fig. 2.
Expression of IL-1RI and IL-23R in stimulated N and NTreg. Ex vivo sorted N and NTreg were stimulated in vitro with anti-CD2/CD3/CD28 microbeads in the presence of the indicated cytokines and cultured in the presence of IL-2. Ex vivo sorted N and NTreg as well as day 5 cultures were stained with antibodies specific for IL-1RI (A) and IL-23R (B) and analyzed by flow cytometry. Examples of dot plots for one donor and data for all donors (mean ± SD, n = 5), ex vivo (*) or after culture are shown.

