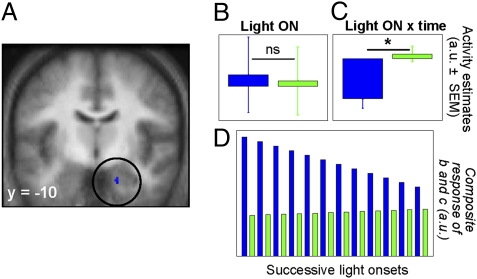
Fig. 3.
Differences in responses to blue and green light onsets in the right amygdala. (A) Statistical results for the blue > green onset contrast modulated by time, overlaid on the population mean structural image (Puncorrected < 0.001). (B) Mean activity estimates [arbitrary units (a.u.) ± SEM] of the constant component of the brain responses associated with blue and green light onsets across the entire session; difference between conditions is nonsignificant (ns). (C) Estimates of the linear change component (a.u. ± SEM) of the brain responses associated with blue and green light onsets across the entire session, showing a significant (*) negative component for blue light onsets, suggesting an adaptation of amygdala responses with time. (D) Composite of both components showing the evolution of the responses to the 12 blue and green light onsets of the session.

