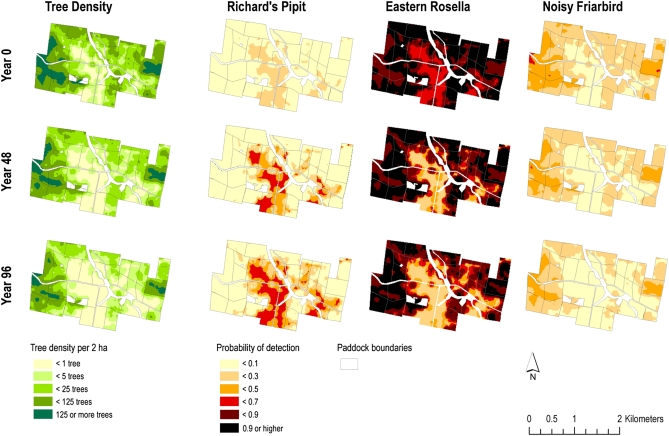
Fig. 1.
Predicted changes in tree density and three species of birds on one of the farms modeled. Richard's pipit had a negative response to tree cover, the eastern rosella had a quadratic response to tree cover, and the noisy friarbird had a positive response to tree cover (for details and scientific names, see Table S3). All maps are based on models derived from original empirical data. Similar maps were produced for 32 farms for tree density, 32 bird species, and 6 bat species at 5 time steps. Robust interpretation should focus on the average patterns predicted across all farms (Fig. 2); the above example for a specific farm is for illustration purposes only.

