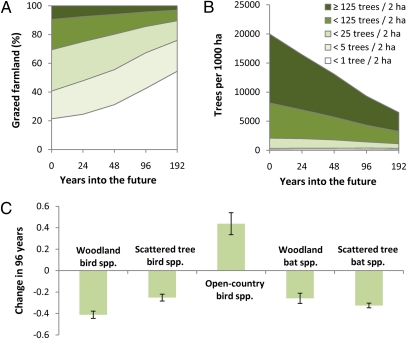
Fig. 2.
Predicted changes in the amount of an average farm occupied by tree cover at different densities (A), the number of trees on an average farm occurring at different densities (B), and the number of bird detections and the level of bat activity on an average farm (C). For A and B, data are the predicted means across 32 farms, scaled for each farm to 1,000 ha of grazed land. A numerical summary including SEMs is given in Table S2. For C, species are classified according to their response to tree cover (negative response = open-country species; quadratic response = scattered tree species; positive response = woodland species; Table S3 and S4). Bars summarize predicted mean changes (±SE) within a given group of species. For details on individual species, see Table S5.

