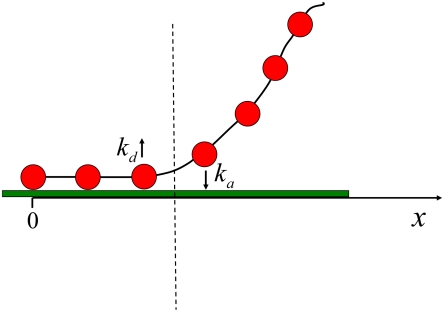
Fig. 5.
Schematic illustration of the cell spreading and retraction model. The beads represent integrin receptor clusters, while the chain represents the cell membrane. The cell edge is represented by the dashed line. Receptor clusters adjacent to the cell edge can adsorb or desorb with rate constants ka and kd, respectively.

