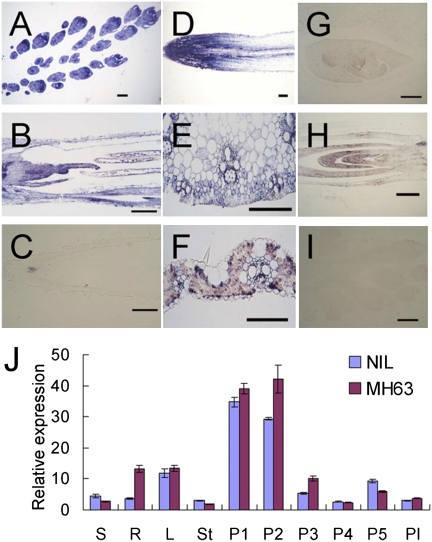
Fig. 3.
Expression pattern of GS3. (A–H) Expression of GS3 in various tissues revealed by in situ hybridization: (A) panicle at stage of pollen mother cell formation, (B) panicle at pollen mother cell meiosis, (C) panicle at pollen grain filling, (D) root at trefoil stage, (E) stem at heading stage, (F) leaf at tillering stage, (G) endosperm and embryo 14 d after flowering, and (H) longitudinal section of 7-d-old seedling. (I) Negative control by hybridizing the young panicle with the sense probe. All tissues were sampled from Zhenshan 97 (medium grain). (Scale bars, 200 μm.) (J) Comparative expression pattern of GS3 in Minghui 63 and NIL(c7) in various organs using real-time RT-PCR analysis: S, seedling at trefoil stage; R, root at trefoil stage; L, leaf at tillering stage; St, stem at heading stage; P1, young panicle <1 cm in length; P2, young panicle <5 cm in length; P3, young panicle 5–10 cm in length; P4, panicle before heading >10 cm in length; P5, panicle 5 d after heading; Pl, plumule.

