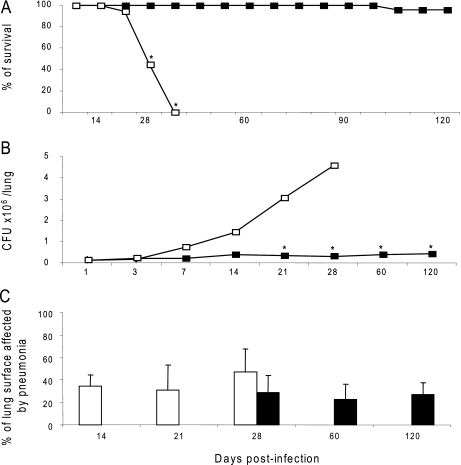
Fig. 2.
Virulence of M. tuberculosis clinical isolates in murine infection model. BALB/c mice were infected by intratracheal injection (2.5 × 10⁵ bacilli) with selected Beijing strains. The virulence of the strain representative of the largest cluster (white symbols) was compared with the virulence of the non-transmitting strain (black symbols). A, Kaplan-Meier survival curves. B, bacillary loads. C, morphometry (percentage of lung surface area affected by pneumonia). Asterisks represent statistical significance (p < 0.005). Error bars indicate 95% confidence intervals.

