Fig. 1.
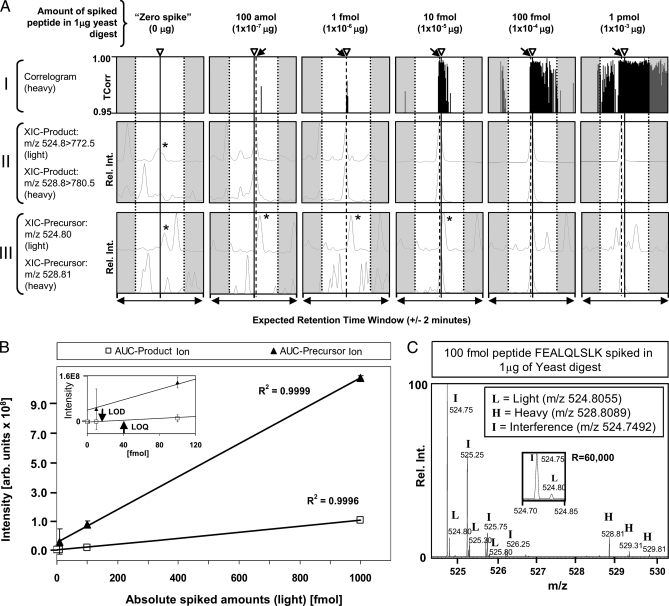
Proof-of-concept: LC-MS/MS analysis of a dilution series of light/heavy (1:1 ratio) synthetic Pou5f1 reference peptide FEALQLSLK spiked into digested yeast extract. A, panel I, correlograms showing TCorr values obtained for the isotope-labeled (heavy) target peptide at different spike levels at the expected target retention time window of ±2 min (estimated based on the sentinel marker peptides as described in supplemental methods). The arrowheads (and solid lines) indicate the center of the estimated retention time, whereas the arrows (and dashed lines) show the observed retention time (apex of chromatographic peak recorded for the heavy peptide) if different from estimated time. A, panel II, extracted ion chromatograms of the major product ions (m/z 772.50 and 780.50) generated by the light (unlabeled) and heavy target peptides (precursor m/z 524.8055 and 528.8089, respectively). A, panel III, extracted ion chromatograms of the target precursor ions (m/z 524.8055 and 528.8089), respectively, of high resolution spectra (R = 60,000) obtained in Orbitrap. The star (*) indicates an isobaric interference (precursor m/z 524.7492 or 524.75, rounded). B, calibration curve showing AUC values calculated for extracted ion chromatograms of the product ion m/z 772.5 (target peptide precursor m/z 524.8055) obtained on an LTQ-Velos ion trap (squares) and the corresponding precursor ion (m/z 524.8055) signal acquired in high resolution spectrum on an Orbitrap (filled triangles). Inset, zoom-in. Arrows mark the LOD of 13.1 fmol and LOQ of 39.3 fmol, respectively. C, zoom-in (m/z 524.30–530.30) of a high resolution full scan spectrum obtained on an Orbitrap of a 100 fmol spike-in experiment showing the isotope envelopes of both the light (L) and heavy (H) precursor ion target and a dominant isobaric (m/z 524.7492) interference (I). Inset, distinct monoisotopic peaks of the light target and the interference. All shown retention time windows were estimated using linear regression of four retention time marker peptides (here called sentinels), which were monitored throughout the experiment. The expected retention time is the linear extrapolation of retention times from the sentinel position in each LC/MS/MS run (for linear regression see supplemental Fig. 2 and supplemental Table 2).

