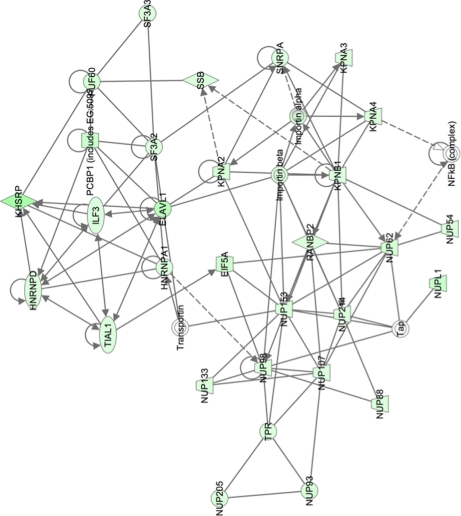
Fig. 4.
Network pathway analysis of proteins identified in nuclear fraction that are primarily involved in molecular transport, including protein and RNA trafficking. Proteins shaded in green indicate a 2-fold or greater decrease in abundance in the nuclear fraction of HRSV-infected cells compared with mock-infected cells, and the color intensity corresponds to the degree of abundance. Proteins in white are those identified through the Ingenuity Pathways Knowledge Base. The shapes denote the molecular class of the protein. A solid line indicates a direct molecular interaction, and a dashed line indicates an indirect molecular interaction. A full explanation of lines and relationships is provided in supplemental Fig. 3.

