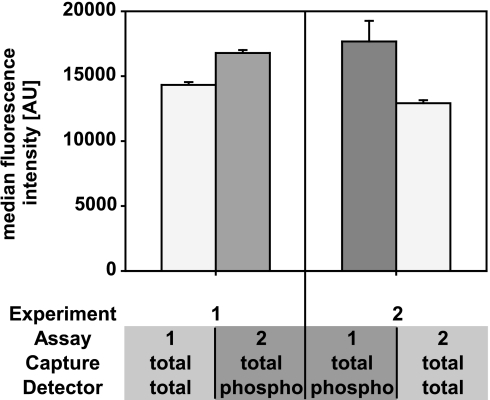
Fig. 4.
Sequential measurement of EGFR and tyrosine phosphorylation of EGFR from same sample. An EGF-stimulated A431 cell line was used for the sequential measurement of EGFR and the generic tyrosine phosphorylation of EGFR. The median fluorescence intensities (n = 3) obtained in two experiments are plotted in the diagram. The left panel shows the results for the experimental order EGFR followed by tyrosine phosphorylated EGFR measurement, and the right panel shows the inverted order. The results do not differ significantly. AU, arbitrary units.

