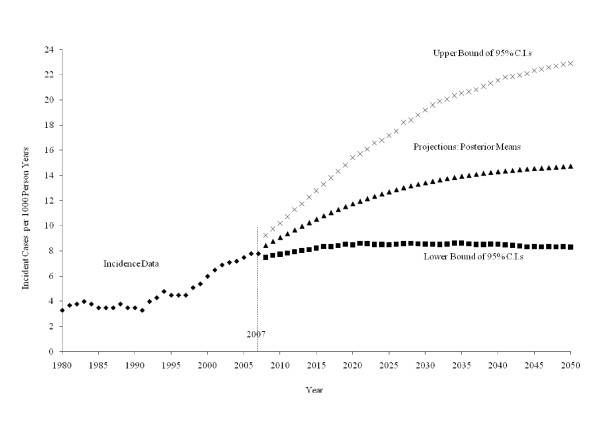
Figure 1.
Incident cases of diagnosed diabetes per 1,000 people, 1980-2007, and three scenarios for projected cases per 1,000, 2008 -2050: a middle scenario (posterior means) and low and high scenarios (lower and upper limits of 95% Bayesian confidence intervals) from the projection model of diagnosed diabetes incidence.

