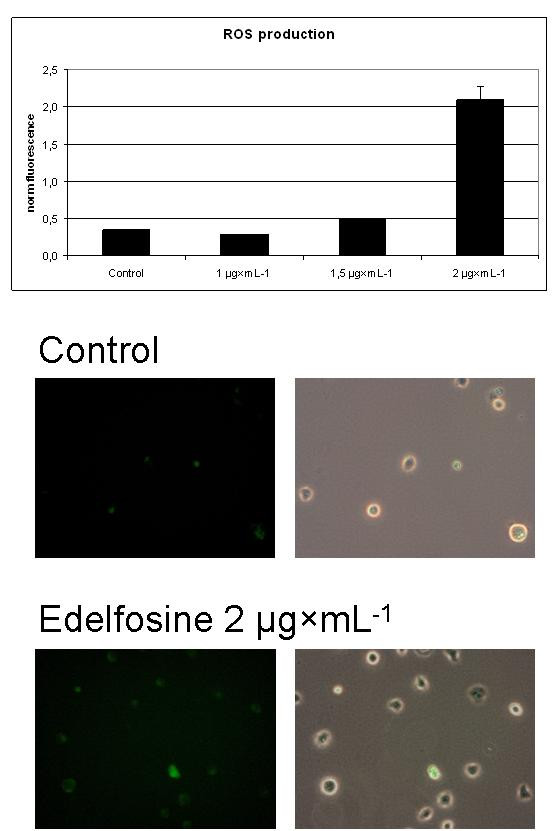
Figure 1.

Increase in DCF fluorescence in edefosine-treated Jurkat cells. The DCF fluorescence as a result of ROS production was measured in a fluorescence microplate reader (top panel) and by fluorescence microscopy (left images, bottom two panels). Also shown are the phase-contrast images superimposed with the fluorescence images of the Jurkat cells (right images, bottom two panels).
