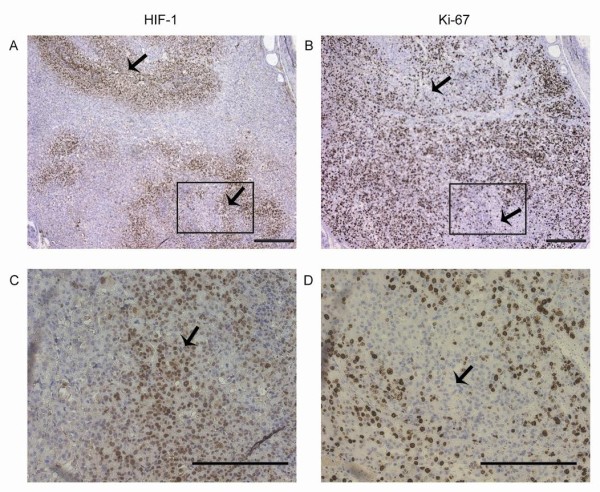
Figure 5.

Relationship between tumour hypoxia and proliferation. Localisation of areas positively stained for HIF1α and Ki67 was visually detected from microscope images in FGF8b and mock tumours. The arrows show positive HIF1α staining and negative Ki67 staining in A and B, and C and D. C and D are captions from the indicated areas in A and B, respectively (Bar 200 μm).
