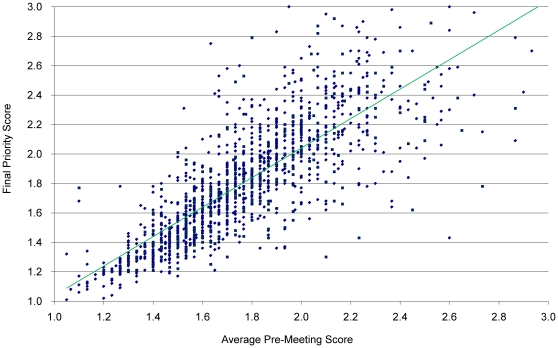
Figure 1. Average Preliminary Score versus SRG Final Priority Score.
Preliminary Scores represent the average of the independent R01 priority scores given by the three assigned reviewers; the final priority score is the average of all the scores given by the voting members of the panel. Each data point represents the outcome for one R01 application. The difference between preliminary and final priority scores represents the change between the two values. Applications with differences displayed on the left declined after discussion; those on the right improved.

