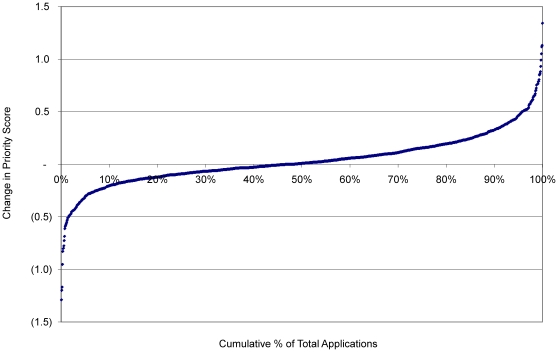
Figure 2. Effects of SRG Meeting Discussion on Final Priority Score.
Applications were rank ordered by the difference between the average preliminary and final priority score of individual R01 applications and then assigned a cumulative percent value. Applications with negative values are displayed on the left and improved after discussion; those on the right were worse after discussion.

