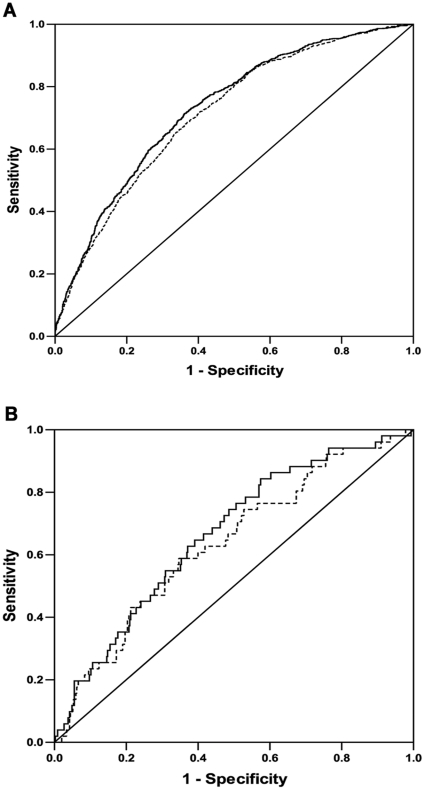
Figure 2. Discriminative improvements attributable to the risk score.
Panel A, the case-control study. The combined effect of genetic risk score and clinical factors on T2DM increased by 1.6% compared to clinical factors. The area under ROC was 0.714 for clinical factors and 0.730 for combined risk score and clinical factors (both P<0.0001). Panel B, the prospective study. The discriminative improvement for incident T2DM by combining the genetic risk score was 2.9% compared with clinical factors (the area under ROC was 0.634 for clinical factors and 0.663 for combined risk factors, P = 0.002 and <0.0001, respectively). The black line represented the combined effect of clinical factors and risk score, and the dotted line was the effect of clinical factors. The clinical factors included age (continuous), gender, family history of diabetes (yes or no) and BMI (continuous). The risk score was categorized as quartiles.

