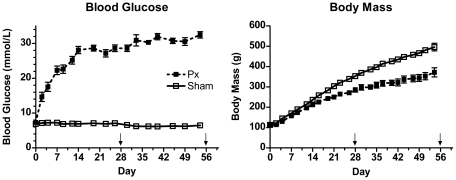
Figure 1. Fed blood glucose levels and body masses in Px and Sham rats following surgery.
Blood glucose level was higher in Px vs. Shams on day 2 following surgery and throughout the protocol (P<0.05). Body mass was lower in Px vs. Shams at day 4 following surgery and throughout the rest of the protocol (P<0.05). Arrows indicate time of harvest for 4 week (n = 14 Px; 9 Shams) and 8 week (n = 11; 15 Shams) groups.

