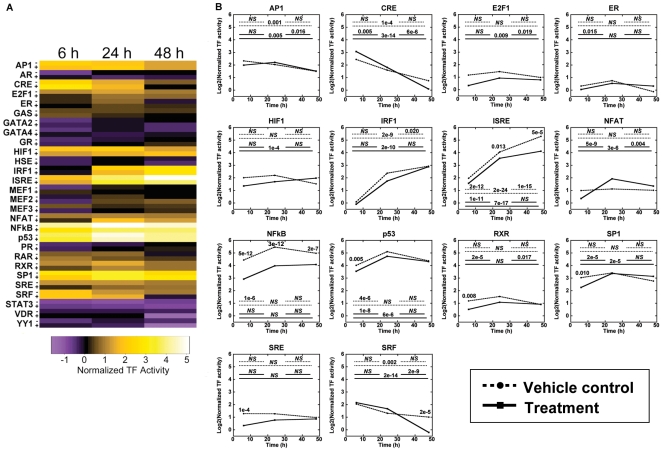
Figure 6. Dynamic large-scale activities of TFs in response to activin A treatment.
(A) TFs had variable activities as functions of treatment and time, as indicated by a heat map representation of log2 transformation of the means. Vehicle control indicated by ‘−’ and activin A treatment indicated by ‘+’. (B) TFs that had significant changes with treatment or time are presented on individual temporal plots, with log2 transformations of the TF activity means plotted. Dashed lines represent vehicle control and solid lines represent activin A treatment. Statistical comparisons are described in legend of Figure 5. Values are log2 transformed means from at least three independent experiments carried out in duplicate for each condition.

