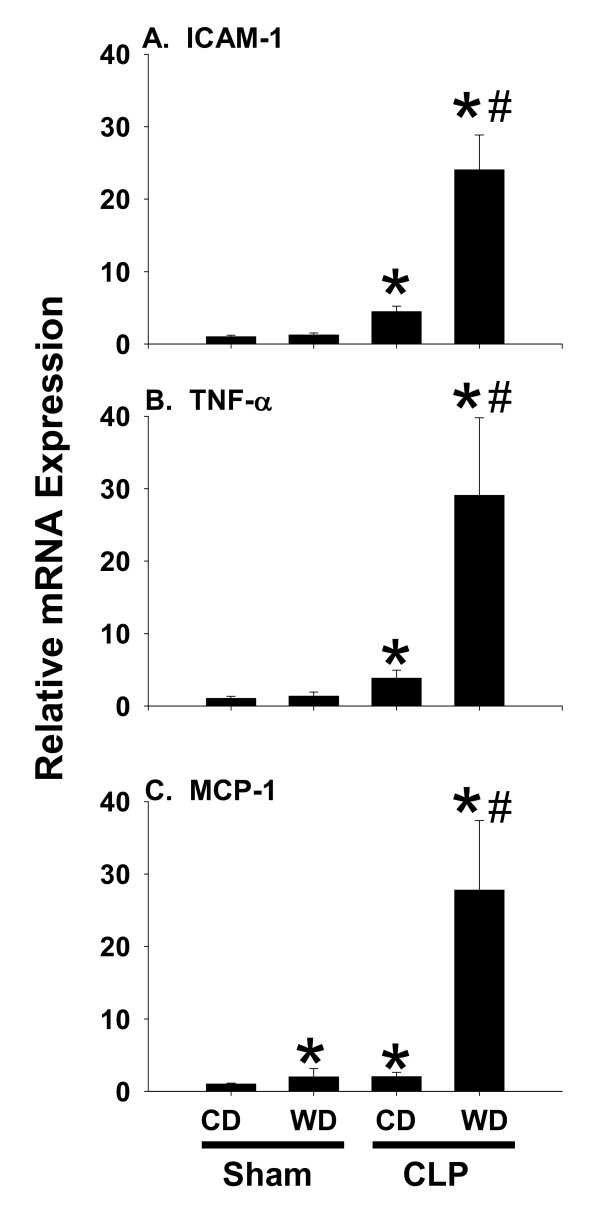
Figure 3.
The expression of pro-inflammatory markers. Expression of (A) ICAM-1, (B) TNF-α and (C) MCP-1 was assessed using pre-developed assays for real-time PCR according to the manufacturer instructions (Applied Biosystems). Data are presented as mean SEM of at least 5 observations/group. Statistical analysis was performed using two-way ANOVA and Tukey's multiple comparisons test. *p < 0.05 compared to diet-matched sham controls; #p < 0.05 compared to corresponding CD-fed mice exposed to CLP.

