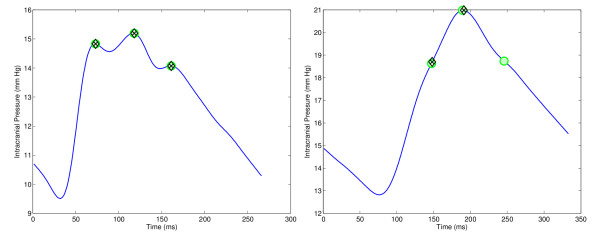
Figure 1.
Illustration of two ICP pulses (the actual position of the peak is depicted in green, MOCAIP prediction in black). On the left, an ICP dominant pulse is correctly annotated with the position of the three peaks. On the right, the automatic annotation failed to correctly recognized the third peak because of the uncommon shape of the pulse. This pulse is considered as a challenging one in our study.

