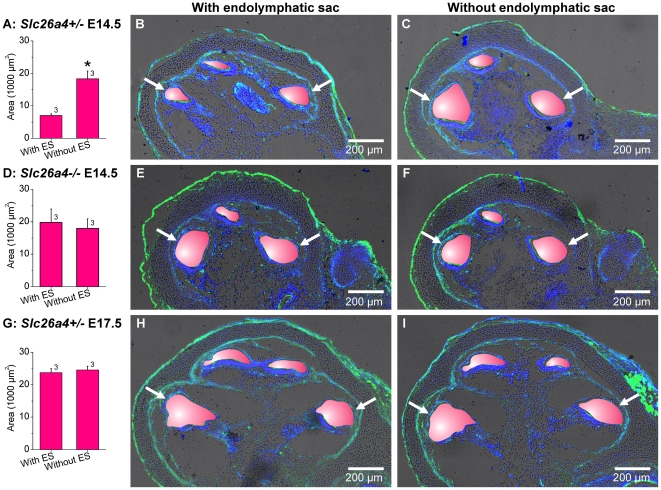
Figure 9. Fluid absorption in the endolymphatic sac ‘drains’ the cochlea during lumen formation.
A, D and G: Luminal area measurements (average of the two basal cross-sections) in cochleae with and without endolymphatic sac. Cochleae were harvested at E14.5 and E17.5 from Slc26a4+/− and Slc26a4−/− mice and maintained two days in organ culture. The number next to the bars represents the N number of animals. Significant differences are marked (*). B and C, cochlear cross-sections of E14.5 Slc26a4+/− mice with and without endolymphatic sac. E and F, cochlear cross-sections of E14.5 Slc26a4−/− mice with and without endolymphatic sac. H and I, cochlear cross-sections of E17.5 Slc26a4+/− mice with and without endolymphatic sac. Scala media was highlighted in pink. Images without the pink overlay are available in Figure S1 (Supporting information). F-actin (green) and nuclei (blue) were labeled. Cochlear cross-sections were imaged by laser-scanning microscopy. Arrows point to the two basal cross-sections, which were used for digital area measurements.

