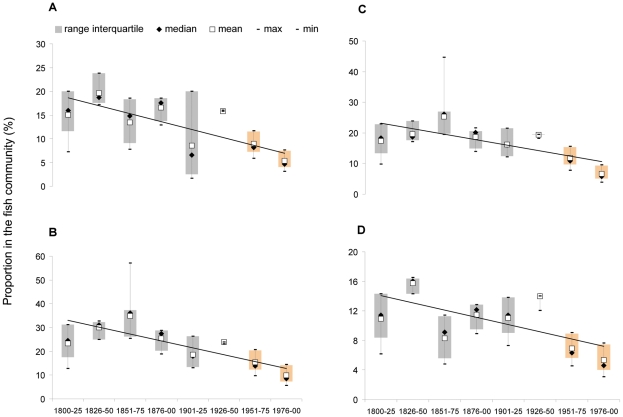
Figure 5. Temporal trends of fish community structure indicators in the period 1800–2000 (N = 87 species/groups of species).
Grey boxes indicate the naturalists' observations of species' perceived abundance, and orange boxes indicate the observed relative composition transformed into classes of perceived abundance. (a) Chondrichthyes; (b) large demersals; (c) species with a maximum body length between 120 and 250 cm; (d) species that reach sexual maturity between the 4th and 6th years of life.

