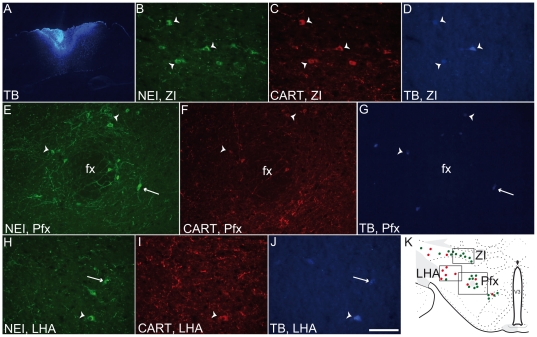
Figure 3. Origin of MCH projections in the mouse cortex.
(A) Photomicrograph illustrating a true blue (TB) injection site in the mouse medial cerebral cortex. (B–J) Photomicrographs showing NEI/CART labeled neurons containing true blue (arrowheads) or neurons containing both NEI and true blue but not CART (arrows). Triple labeled cells were abundant in the zona incerta (ZI) and medial perifornical regions (Pfx), while double labeled cells were mostly found in the lateral hypothalamic area (LHA). The schem in K shows the localization of the three regions and a schematic distribution of NEI/CART and NEI positive/CART negative neurons represented by green and red dots respectively. fx: fornix, V3: third ventricle.

