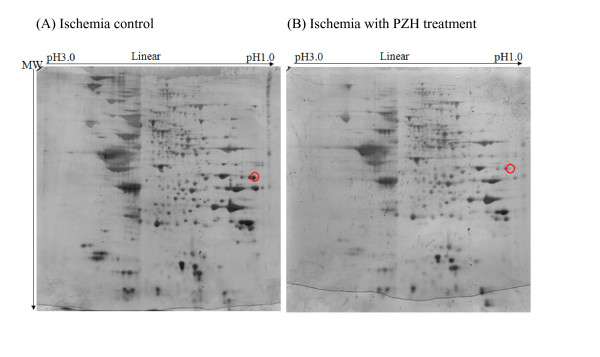
Figure 5.
Representative images of 2D electrophoresis gels. Representative 2D electrophoresis gel photos of brain tissue samples from (A) SHR of ischemia with PZH preventive treatment and (B) SHR of ischemia control. The red circle indicates cytochrome b-c1 complex subunit 2, mitochondrial precursor (QCR2), the protein that down-regulated in both hippocampus and cerebellum in PZH treatment group as compared to controls. There was also no overall inhibition or over expression of proteins in the PZH treatment sample compared with the control sample.

