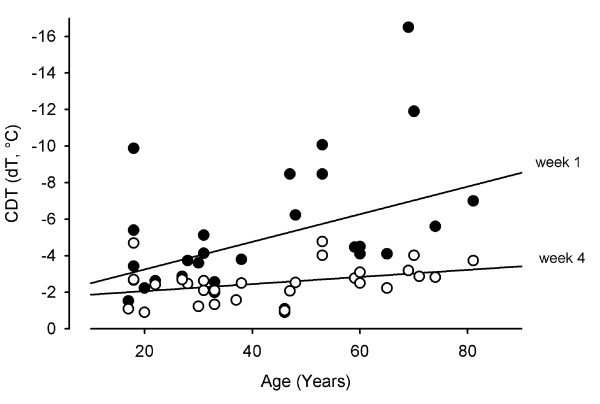
Figure 5.
Correlation between Age and cold detection threshold (CDT) in 30 patients. CDT is given as difference from baseline (32°C; dT). Data were analyzed by Pearson's correlation analysis. Each point represents the results of one subject on week one (black filled spheres) or on week 4 (white filled spheres). The lines show linear regression curves (upper line: 1 week after surgery, lower line: 4 weeks after surgery).

