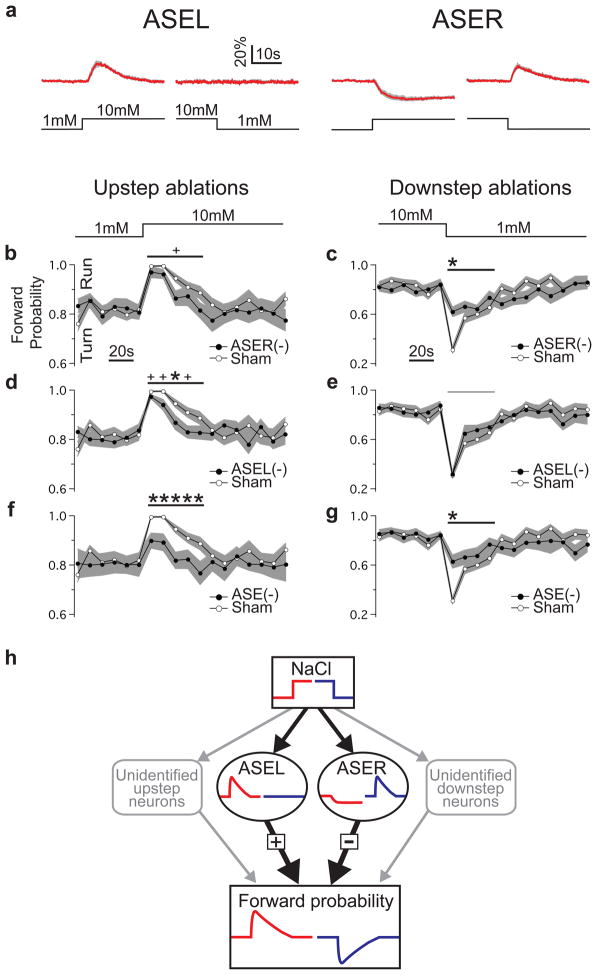
Figure 4. Roles of ASEL and ASER in NaCl step-response behaviour.
a. Average ASE calcium transients in response to concentration steps of ± 9 mM. The concentration step is indicated below each calcium trace. The gray band represents ± 1 standard error of the mean (SEM); n ≥ 5 five recordings, with one recording per worm. b–g. Effects of unilateral and bilateral ASE ablations on the behavioural response to concentration steps. Probability of forward locomotion is plotted against time relative to the step. Statistical significance (ablation vs. sham) was assessed via a repeated measures ANOVA over the indicated time window (horizontal lines above traces) following the step (shown above b and c). Notation and symbols: ASEL(−), ASEL ablation; ASER(−), ASER ablation; ASE(−), bilateral ASE ablation; thick horizontal line, ANOVA significant at p < 0.05 or less; thin horizontal line, not significant; stars, time points at which there were significant difference between means after correcting for multiple comparisons (t test; p < 0.05); pluses, time points at which there were significant differences in uncorrected t tests (p < 0.05). Imaging and behavioural data are from different individuals. The gray band represents ± 1 standard error of the mean with n ≥ 15 in each panel. h. Functional connectivity implied by b–g together with imaging data (panel a and Fig. 1a,b) and unilateral activation experiments (Fig. 3). Unidentified neurons (shown in gray) account for residual behavior when ASE is ablated.

