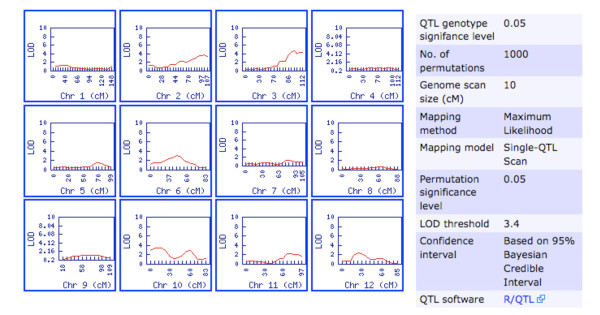
Figure 1.
Genome-wide QTL mapping output. An example of genome-wide QTL mapping output from solQTL for a trait called 'Fruit Area' (see supplemental figure 2) and legend detailing the analysis parameters (Source: http://solgenomics.net/phenome/population_indls.pl?population_id=12&cvterm_id=39945/). Clicking a linkage group with a significant QTL (eg. Chr 3) leads to the QTL detail page (see Figure 2).

