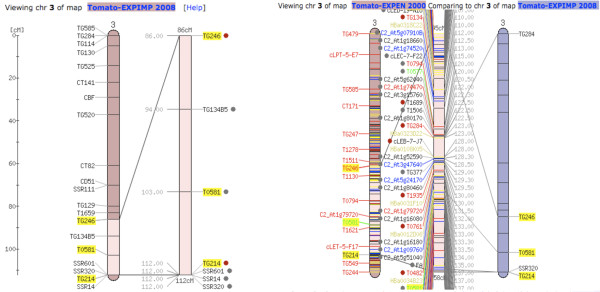
Figure 3.
Comparative genetic analysis of a predicted QTL with other genetic maps. Panel (A) shows an example linkage map with a zoomed out QTL segment, generated after clicking the linkage group link on the detail page of the QTL of interest (see Figure 2). (B) shows a comparison of the QTL shown on (A) to the Tomato-EXPEN 2000 (F2.2000) consensus genetic map. The zoomed out region, generated after manually feeding the Comparative Map Viewer with the QTL marker positions on the F2.2000 map instead of their genetic positions in the Tomato-EXIMP 2008 map, displays greater number of markers from the reference map within the shared genetic segment between the two maps.

