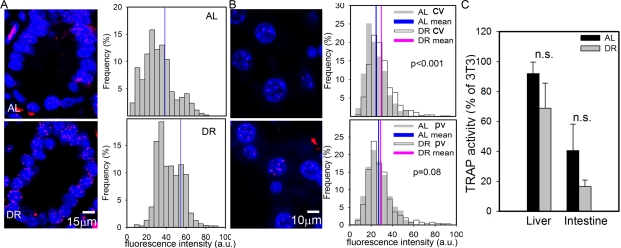
Figure 2. DR improves telomere maintenance.
(A) Representative Q-FISH images (left panels, red: telomeres, blue: nuclei) and distribution of enterocyte telomere fluorescence intensity per nucleus (right panels, n≥2230 nuclei, 5 animals) in intestinal crypts. Mean nuclear telomere fluorescence intensity is indicated by blue vertical lines. p<0.001, Mann-Whitney rank sum test. (B) Representative Q-FISH images (left panels, red: telomeres, blue: nuclei) and distribution of hepatocyte telomere fluorescence intensity in centrilobular (CV, top, n≥560 nuclei) and periportal (PV, bottom, n≥650 nuclei) in liver areas. Mean fluorescence intensities are indicated for AL (blue) and DR (pink). P-values for AL vs DR were calculated by Mann-Whitney rank sum test. (C) Telomerase catalytic activity (% of TRAP activity in 3T3 cells) in whole liver (left, n=4) and intestinal mucosa (right, n=5) homogenates. Data are mean±S.E.M. n.s.: not significant (T-test).

