Abstract
rSNP_Guide is a novel curated database system for analysis of transcription factor (TF) binding to target sequences in regulatory gene regions altered by mutations. It accumulates experimental data on naturally occurring site variants in regulatory gene regions and site-directed mutations. This database system also contains the web tools for SNP analysis, i.e., active applet applying weight matrices to predict the regulatory site candidates altered by a mutation. The current version of the rSNP_Guide is supplemented by six sub-databases: (i) rSNP_DB, on DNA–protein interaction caused by mutation; (ii) SYSTEM, on experimental systems; (iii) rSNP_BIB, on citations to original publications; (iv) SAMPLES, on experimentally identified sequences of known regulatory sites; (v) MATRIX, on weight matrices of known TF sites; (vi) rSNP_Report, on characteristic examples of successful rSNP_Tools implementation. These databases are useful for the analysis of natural SNPs and site-directed mutations. The databases are available through the Web, http://wwwmgs.bionet.nsc.ru/mgs/systems/rsnp/.
INTRODUCTION
Application of Single Nucleotide Polymorphism (SNP) analysis to the human genome is currently among the greatest challenges presented by the human genome sequence initiative (1). This novel research field permits exploration of the influence of specific sequence alterations on disease susceptibility, drug resistance/sensitivity and ultimately health care. The number of experimentally detected SNPs is growing tremendously. Currently the HGMD database (2) contains more than 10 000 SNPs that alter codon translation, more than 1000 that affect splice sites, and less than 200 that influence gene regulatory regions. In the databases, dbSNP (3), HGBASE (4), ALFRED (5) and OMIM (6), SNPs in regulatory and coding regions are represented in a similar ratio. Obviously, functional alteration of highly conserved codons and splice sites, resulting in alteration of protein structure and function, are detected more easily than less conserved regulatory regions such as promoters, enhancers, silencers, introns, etc. (7). Recent experiments (8–10) have shown that regulatory SNPs may be manifest in several ways, including: (i) alteration of function of a site important for normal regulation; (ii) a difference in affinity of protein binding at such a site; or (iii) acquired function of a site not normally participating in proper regulation. Thus, as has been shown experimentally (9,10), the influence of an SNP cannot be predicted reliably, only by inspection of the local region for potential regulatory elements similar to those of known sequence.
Although SNP analysis is only now being applied to regulatory regions, it is being developed using experimental findings in the databases TRANSFAC (11), TRRD (12), COMPEL (13), ACTIVITY (14) and others, which accumulate information not only about naturally occurring site variants, but also resulting from intentional (site-directed) mutagenesis. Among the latter artificial variants, site-directed mutagenesis altering several nucleotides is more informative for SNP analysis of regulatory DNA regions than deletions, insertions or hybrid constructs. Since disease penetration may be affected not only by the presence or absence of a transcription factor (TF) binding site in a regulatory region, but also by quantitative alterations of binding efficiency [e.g., erythroid-specific DNA-binding protein(s) affinity alterations cause δ-thalassemia; 15], the data on sequence-activity relationships are informative for SNP analysis of regulatory regions. We anticipate that further development of the present database will actually have prescriptive value for specific applications in disease.
From this perspective, our web-resource rSNP_Guide integrates experimental data on natural SNPs with sequence variations generated artificially. The core of this resource is the database rSNP_DB. It compiles data on alterations in DNA binding by nuclear proteins observed due to natural and experimental sequence variations. This information is represented in a simple format adopted for computer analysis. rSNP_DB is supplemented by four databases: (i) SYSTEM, experimental conditions; (ii) rSNP_BIB, references to original publications; (iii) SAMPLES, multiple alignments of the known TF-sites sequences; and (iv) MATRIX, weight matrices for TF site recognition. To apply the information stored in these databases to SNP-analysis of DNA regulatory regions, we have developed the Java-script applet, rSNP_Tools. We have tested this rSNP_Tools on a series of examples, which represent both naturally occurring mutations and relevant artificial constructs. These test results are documented in the rSNP_Report database and are helpful for analysis of SNPs and mutagenesis. The rSNP_Guide is available through the Web, http://wwwmgs.bionet.nsc.ru/mgs/programs/rsnp/.
DATA REPRESENTATION
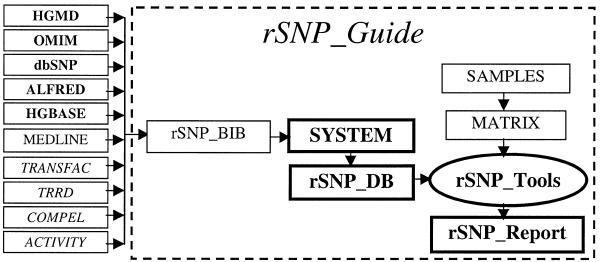
A graphical representation of the rSNP_Guide components and sources of information is given in Figure 1. In this figure, the arrows link the components of the rSNP_Guide and related web resources. Initial information on the naturally occurring mutations is extracted from original publications and the databases HGMD (2), dbSNP (3), HGBASE (4), ALFRED (5) and OMIM (6), whereas the site-directed mutagenesis data are taken from TRANSFAC (11), TRRD (12), COMPEL (13) and ACTIVITY (14). Using the original publications (rSNP_BIB), we document the experimental conditions (SYSTEM). Taking into account experimental conditions, the data on alterations in nuclear protein binding to DNA with point mutations are accumulated in rSNP_DB. Next, typical examples of the rSNP_DB entries are chosen and investigated using the Java-script applet rSNP_Tools, which implements SAMPLES and MATRIX (16). Finally, the results are stored in the database rSNP_Reports.
Figure 1.
Scheme of rSNP_Guide components (blocked in a dashed line) and sources of information on naturally occurring mutations (bold) and on artificial constructs (italicized).
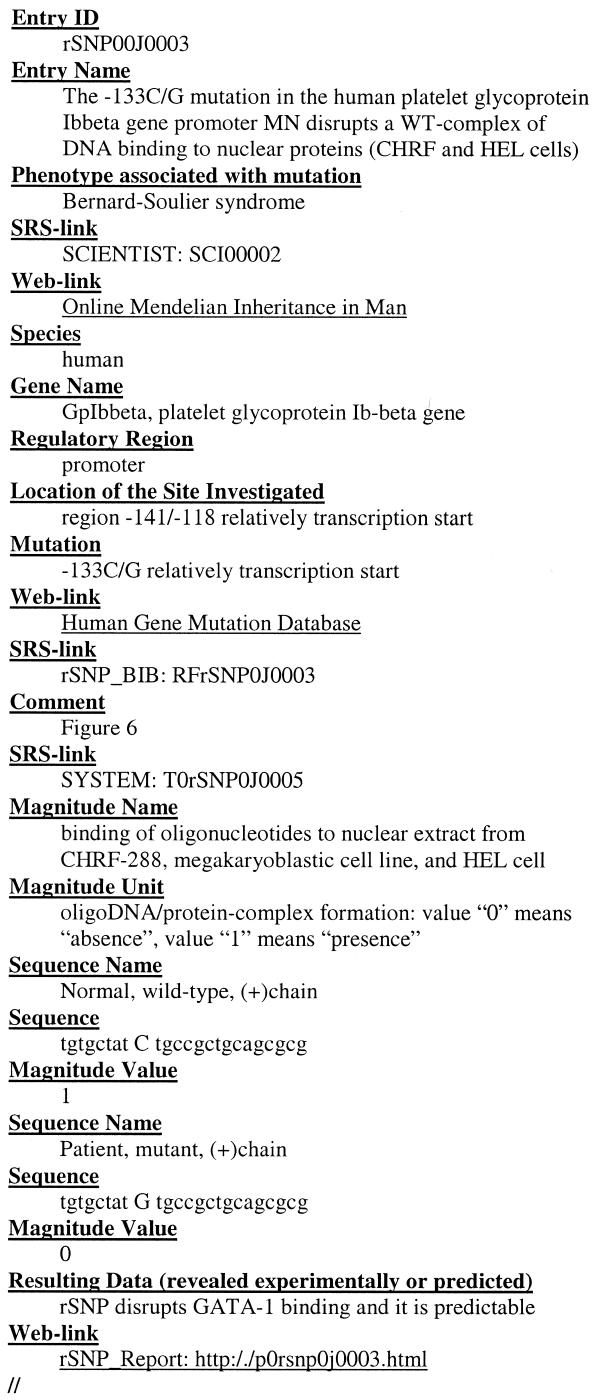
Each entry of the core database, rSNP_DB, contains the information on DNA–protein interaction alterations caused by mutation. The entry has 16 descriptive field names (Fig. 2). These field names are color-coded. If a user clicks the field name, the Help function is activated in a separate window, which contains information about formatting the data, examples, etc. With the keywords, the database can be queried using SRS (17).
Figure 2.
Example of a rSNP_DB entry. The descriptive field names are in bold. The links to the User’s Help and to the other related web resources are underlined.
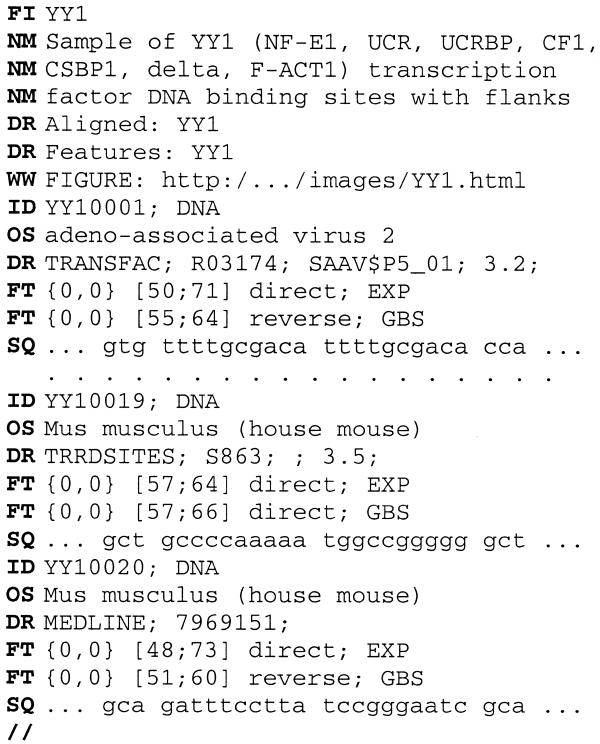
The second database, SYSTEM, contains the accumulating data on experimental systems. The entry has nine descriptive field names. By analogy to rSNP_DB, each field is supported by the Help function. The detailed description of the SYSTEM format is given in (14). The third database, rSNP_BIB, contains the citations to original publications. The fourth database, SAMPLES, compiles the experimentally identified DNA sequences of known sites (Fig. 3). Consistent with EMBL notation, a SAMPLES sub-database entry has eight fields: FI, identifier; NM, name; WW, web resource; ID, site; OS, species; DR, database; FT, site core (EXP, footprint; GBS, multiple alignment; 18); SQ, 120 bp sequence centered according to footprinting. The entry provides a user with experimentally detected sequences of known regulatory sites (SQ). Two keyword fields, ID and OS, permit searching with the SRS query system. Several relevant web links are included (DR and WW). The fifth supplementary database, MATRIX, documents the weight matrices of the known regulatory sites. The entry of this database is described in detail by Ponomarenko et al. (16). By clicking the field name, the Help file is loaded in a new window.
Figure 3.
Example of a SAMPLES entry.
HOW TO USE THE rSNP_Guide FOR ANALYSIS OF TRANSCRIPTION FACTOR BINDING TO TARGET SEQUENCE
The user must first have a target sequence and mutated variants of interest for the (+) and (–) strands. For example, to use rSNP_Guide for analysis of the human platelet glycoprotein Ibβ gene, GpIbβ, the promoter allele of which (‘–133C/G’) has been associated with Bernard–Soulier syndrome (19), four DNA sequences should be initially prepared, such as the wild-type allele ‘WT’ (+)-chain, 5′-tgtgctatCtgccgctg-3′, and (–)-chain, 5′-cagcggcaGatagcaca-3′; the mutant allele ‘–133C/G’, 5′-tgtgctatGtgccgctg-3′ and 5′-cagcggcaCatagcaca-3′ (where nucleotide alterations are underlined).
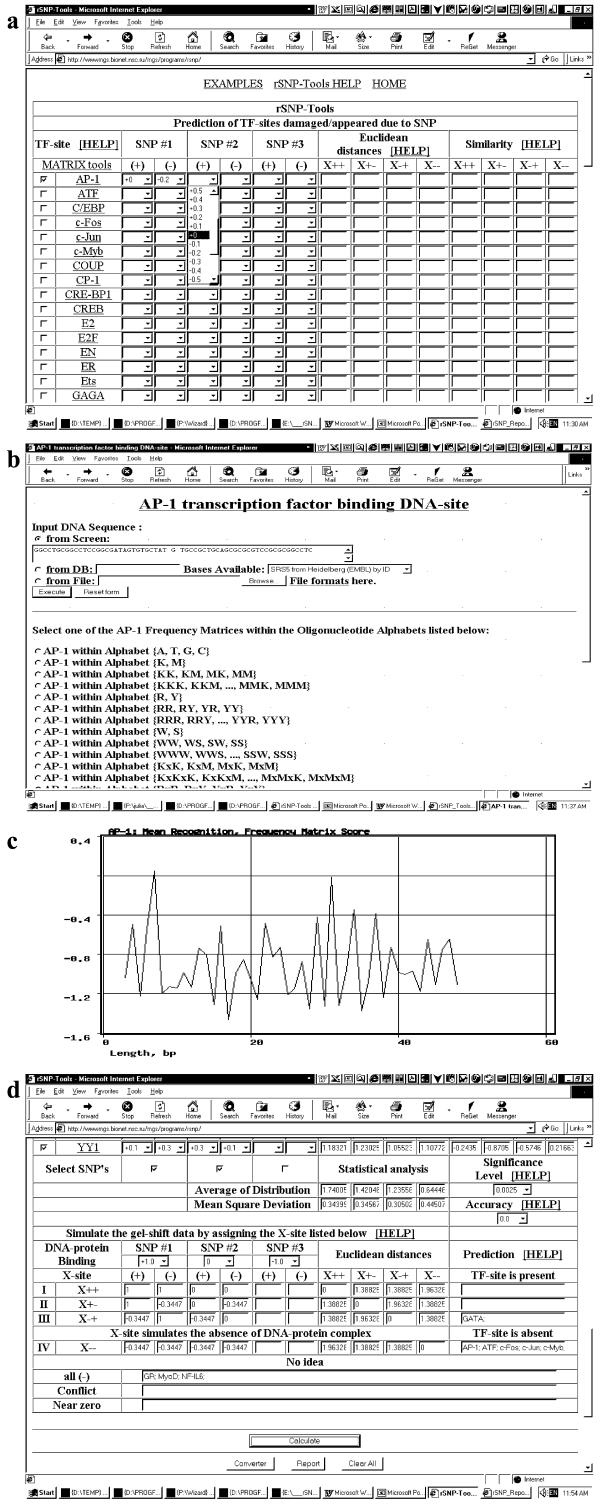
rSNP_Tools (http://wwwmgs.bionet.nsc.ru/mgs/programs/rsnp/) is uploaded, giving the screen shown in Figure 4a. In the upper section of the user interface window, a TF is selected. When a TF is clicked on, a window appears for its corresponding site recognition (Fig. 4b). The user enters into the input box each sequence variant (Fig. 4c) and for each the button ‘Execute’ is clicked. Clicking brings up a screen (Fig. 4c) with the graphical representation of the TF site recognition score. With a single dominant peak, the corresponding score on the left axis is entered in the proper box in the user interface (Fig. 4a). In our example, the DNA sequence, ‘5′-tgtgctatGtgccgctg-3′’, ‘-133C/G’ allele, (+)-chain, was entered into the AP-1 binding site recognition program (Fig. 4b). For this sequence variant, the AP-1 site recognition Score profile has a single peak (Fig. 4c) with the maximal value ‘0’, which is put into the proper box (Fig. 4a). In the case of multiple peaks, the user can choose a peak according to relative height or proximity to a sequence region most likely to influence binding. When all sequence variants of interest have been examined and the data entered in the user interface, the next TF is selected and the process repeated.
Figure 4.
Explanation how to use rSNP_Tools: (a), user interface (upper section); (b), input window of TF recognition program; (c), output window of TF recognition program; (d), user interface (bottom section).
When all TFs of interest have been examined, the experimental data are entered in the bottom section of the user interface window (Fig. 4d). In this section, the user enters in line ‘DNA/protein Binding’ data for each sequence variant, estimating the relative degree of protein binding on a scale of +1 (maximal) to –1 (minimal). In our example, it was experimentally determined (19) that the gel mobility shift assay of the GpIbβ gene allele ‘WT’ contains a band corresponding to the DNA complex with unknown nuclear protein, whereas in the case of ‘–133C/G’ allele, this band is absent (19). In Figure 4d, there is an illustration of how these experimental data are entered into the proper boxes of the field ‘DNA–protein binding’: i.e., the first allele, ‘WT’, was assigned the input value ‘+1’, and, the second allele, ‘–133C/G’, the value ‘0’.
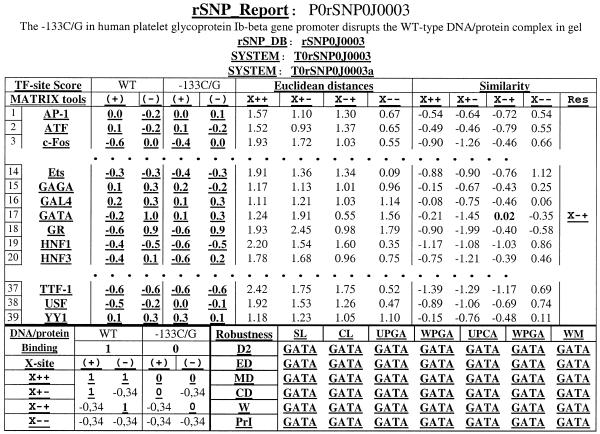
Then the button ‘Calculate’ should be clicked, following which the calculated values will appear in the window ‘Prediction’. A single TF may be predicted to bind. In our example (Fig. 4d), the site GATA was predicted to be a TF site candidate responsible for Bernard–Soulier syndrome (19).
In the case where several TFs are predicted, the relevant matches and closeness of fit to the data are evident in the statistical analysis windows. Euclidean distance is calculated by comparison of the predicted alteration with the experimental data, and corresponding t-test values are shown for each TF. If no TF is predicted, the significance value (P = 0.025, default) can be changed to P = 0.05, or 0.1. Each section of the user interface is supported by the Help function, which explains the meaning or usefulness of each box. To assist the inexperienced user, sample reports are available to show how the rSNP_Tools have been used successfully. The database rSNP_Report accumulates the reports of the rSNP_Tools practical usage. For the given example, the database entry is shown in Figure 5. The quarterly updated reports are available, demonstrating rSNP_Tools usefulness for analysis of natural SNPs and site-directed mutations.
Figure 5.
Example of a rSNP_Report entry. The links to the User’s Help and to the other related web resources are in bold and underlined.
DATABASE CONTENT
The first release of the core database, rSNP_DB, contains 46 entries, which characterize 100 DNA variants, including 26 entries that describe naturally occurring mutations and 20 entries with site-directed mutagenesis. Eighteen entries contain information on quantitative alterations of DNA–protein interactions and 28 are characterized by the site presence/absense. Each rSNP_DB entry is linked to the SYSTEM database (44 entries), which describes experimental conditions, and the rSNP_BIB database, which accumulates citations to original publications. The supplementary database SAMPLES compiles more than 2000 experimentally identified sequences of more than 50 known regulatory sites. For 41 regulatory sites, more than 500 weight matrices at 32 oligonucleotide alphabets were documented by the knowledge base MATRIX (16).
The tool applying these weight matrices for site recognition is available through the Web, http://wwwmgs.bionet.nsc.ru/mgs/programs/rsnp/. Since the SNP analysis is still under development, we have chosen only characteristic examples for documentation in the rSNP_Report database. The examples illustrate single, double, triple or quadruple nucleotide substitutions. Among these examples are mutations damaging conserved nucleotides in natural TF site cores and mutations in variable TF site positions, which slightly modulate gene expression (http://wwwmgs.bionet.nsc.ru/mgs/programs/rsnp/images/). These reports are addressed to users to help them choose the most appropriate strategy of data analysis for their interests. We believe that this coordinated approach may be useful for further SNP analysis and for experimental design in mutagenesis.
AVAILABILITY
The rSNP_Guide is available through the Web, http://wwwmgs.bionet.nsc.ru/mgs/systems/rsnp/. Please email all rSNP_Guide applications to the corresponding author or request collaboration through Prof. N. A. Kolchanov (kol@bionet.nsc.ru). No inclusion of the rSNP_Guide into other databases is permitted without explicit permission of the authors. Please send comments, corrections and requests by email or fax. We kindly ask that this article be cited when reporting results based on rSNP_Guide usage.
Acknowledgments
ACKNOWLEDGEMENTS
The authors would like to thank Prof. Robert H. Rice (University of California, Davis, CA) for critical review of the manuscript and contributing to its preparation in English. The work is supported by grants RFBR-98-07-910126 (Russia) and RFBR-00-04-49548 (Russia) and STA Fellowship no. 499042 (Japan).
References
- 1.Haussler D. (1998) Computational genefinding. Trends Guide in Bioinformatics, 1, 12–15. [Google Scholar]
- 2.Krawczak M., Ball,E.V., Fenton,I., Stenson,P.D, Abeysinghe,S., Thomas,N. and Cooper,D.N. (2000) Human gene mutation database-a biomedical information and research resource. Hum. Mutat., 15, 45–51. [DOI] [PubMed] [Google Scholar]
- 3.Smigielski E., Sirotkin,K., Ward,M. and Sherry,S.T. (2000) dbSNP: a database of single nucleotide polymorphisms. Nucleic Acids Res., 28, 352–355. Updated article in this issue: Nucleic Acids Res. (2001), 29, 308–311. [DOI] [PMC free article] [PubMed] [Google Scholar]
- 4.Brookes A., Lehvaslaiho,H., Siegfried,M., Boehm,J.G., Yuan,Y.P., Sarkar,C.M., Bork,P. and Ortiga,F. (2000) HGBASE: a database of SNPs and other variations in and around human genes. Nucleic Acids Res., 28, 356–360. [DOI] [PMC free article] [PubMed] [Google Scholar]
- 5.Cheung K., Osier,M.V., Kidd,J.R., Pakstis,A.J., Miller,P.L. and Kidd,K.K. (2000) ALFRED: an allele frequency database for diverse populations and DNA polymorphisms. Nucleic Acids Res., 28, 361–363. Updated article in this issue: Nucleic Acids Res. (2001), 29, 317–319. [DOI] [PMC free article] [PubMed] [Google Scholar]
- 6.McKusick V. (1998) Mendelian Inheritance in Man. Catalogs of Human Genes and Genetic Disorders. Johns Hopkins University Press, Baltimore, MD.
- 7.Searls D.B. (2000) Using bioinformatics in gene and drug discovery. Drug Discovery Today, 5, 135–143. [DOI] [PubMed] [Google Scholar]
- 8.Merkulova T.I., Vasiliev,G.V., Ponomarenko,M.P., Kobzev,V.F., Podkolodnaya,O.A., Ponomarenko,J.V. and Kolchanov,N.A. (2000) Analysis of the region of intron 6 of the human TDO2 gene in that point mutations associated with psychiatric disorders are located with the aid of computer and experimental approaches. In Kolchanov,N.A. (ed.), Proceedings of the International Conference ‘Bioinformaticsfor Genome Regulation and Structure, BGRS’2000, August 7–14, 2000, Novosibirsk, Russia’. IC&G Publishers, Novosibirsk, 1, 134–138.
- 9.Vasiliev G.V., Merkulov,V.M., Kobzev,V.F., Merkulova,T.I., Ponomarenko,M.P. and Kolchanov,N.A. (1999) Point mutations within 663–666 bp of intron 6 of the human TDO2 gene, associated with a number of psychiatric disorders, damage the YY-1 transcription factor binding site. FEBS Lett., 462, 85–88. [DOI] [PubMed] [Google Scholar]
- 10.Bienvenu T., Lacronique,V., Raymondjean,M., Cazeneuve,C., Hubert,D., Kaplan,J.C. and Beldjord,C. (1995) Three novel sequence variations in the 5′ upstream region of the cystic fibrosis transmembrane conductance regulator (CFTR) gene: two polymorphisms and one putative molecular defect. Hum. Genet., 95, 698–702. [DOI] [PubMed] [Google Scholar]
- 11.Wingender E., Chen,X., Hehl,R., Karas,H., Liebich,I., Matys,V., Meinhardt,T., Prüß,M., Reuter,I. and Schacherer,F. (2000) TRANSFAC: an integrated system for gene expression regulation. Nucleic Acids Res., 28, 316–319. Updated article in this issue: Nucleic Acids Res. (2001), 29, 281–283. [DOI] [PMC free article] [PubMed] [Google Scholar]
- 12.Kolchanov N.A., Podkolodnaya,O.A., Ananko,E.A., Ignatieva,E.V., Stepanenko,I.L., Kel-Margoulis,O.V., Kel,A.E., Merkulova,T.I., Goryachkovskaya,T.N., Busygina,T.V. et al., (2000) Transcription regulatory regions database (TRRD): its status in 2000. Nucleic Acids Res. 28, 298–301. [DOI] [PMC free article] [PubMed] [Google Scholar]
- 13.Kel-Margoulis O.V., Romashchenko,A.G., Kolchanov,N.A., Wingender,E. and Kel,A.E. (2000) COMPEL: a database on composite regulatory elements providing combinatorial transcriptional regulation. Nucleic Acids Res., 28, 311–315. [DOI] [PMC free article] [PubMed] [Google Scholar]
- 14.Ponomarenko J.V., Furman,D.P., Frolov,A.S., Podkolodny,N.L., Orlova,G.V., Ponomarenko,M.P., Kolchanov,N.A. and Sarai,A. (2001) ACTIVITY: a database on DNA/RNA sites activity adapted to apply sequence-activity relationships from one system to another. Nucleic Acids Res., 29, 284–287. [DOI] [PMC free article] [PubMed] [Google Scholar]
- 15.Moi P., Loudianos,G., Lavinha,J., Murru,S., Cossu,P., Casu,R., Oggiano,L., Longinotti,M., Cao,A. and Pirastu,M. (1992) δ-Thalassemia due to a mutation in an erythroid-specific binding protein sequence 3′ to the δ-globin gene. Blood, 79, 512–516. [PubMed] [Google Scholar]
- 16.Ponomarenko M.P., Ponomarenko,J.V., Frolov,A.S., Podkolodnaya,O.A., Vorobyev,D.G., Kolchanov,N.A. and Overton,G.C. (1999) Oligonucleotide frequency matrices addressed to recognizing functional DNA sites. Bioinformatics, 15, 631–643. [DOI] [PubMed] [Google Scholar]
- 17.Etzold T. and Argos,P. (1993) SRS–an indexing and retrieval tool for flat file data libraries. Comput. Applic. Biosci., 9, 49–57. [DOI] [PubMed] [Google Scholar]
- 18.Lawrence C. (1994) Toward the unification of sequence and structural data for identification of structural and functional constraints. Comput. Chem., 18, 255–258. [DOI] [PubMed] [Google Scholar]
- 19.Ludlow L.B., Schick,B.P., Budarf,M.L., Driscoll,D.A., Zackai,E.H., Cohen,A. and Konkle,B.A. (1996) Identification of a mutation in a GATA binding site of the platelet glycoprotein Ibβ promoter resulting in the Bernard-Soulier syndrome. J. Biol. Chem., 271, 22076–22080. [DOI] [PubMed] [Google Scholar]


